Minnesota’s shrinking share of workers will slow the state’s future economic growth
Over the last few weeks, I’ve gone over our new report, The State of Minnesota’s Economy: 2017, in a bit of detail. Having talked a bit about the state’s economy from the turn of the century to now, what might the future hold for Minnesota’s economy?
What makes per capita GDP grow?
GDP per capita – Total GDP/Population – is what matters for economic well being. Doubling GDP if population also double means that each person is, on average, no better off than they were before.
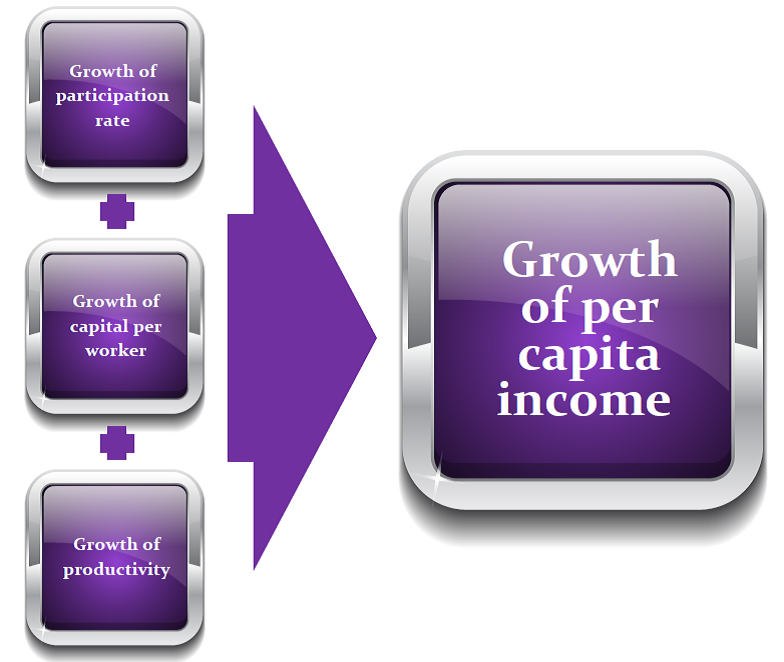
As Figure 1 illustrates, the growth rate of GDP per capita can be thought of as the sum of 1) the percentage growth of the participation rate, 2) the percentage growth rate of capital per worker, and 3) the percentage growth rate of Total Factor Productivity. To get some idea of what is in store for Minnesotan’s in terms of the important metric of GDP capita, we can look at the prospects for each of these in turn. We can start with Minnesota’s labor force.
Figure 1: The sources of per capita GDP growth
Labor Force Participation in Minnesota
Up to a point, it is a good thing to have a large share of your population working. There more that there are producing goods and services – GDP – then the more GDP their is to divide among the population. This will drive higher GDP per capita.
The Labor Force Particpation rate – the percentage of the population that is either employed or unemployed but actively seeking work – measures this. Minnesota currently does very well by this standard. Our state’s labor force participation rate—69.5 percent in 2016—has long been among the highest in the country. But demographic changes are impacting Minnesota’s labor force as they are across the western world. As Figure 2 shows, over the last 16 years, as the nation’s participation rate has declined due to an aging population, so has Minnesota’s, by 5.9 percentage points since 2000.
Figure 2: Labor Force Participation Rates in the US and Minnesota, 2000 to 2016
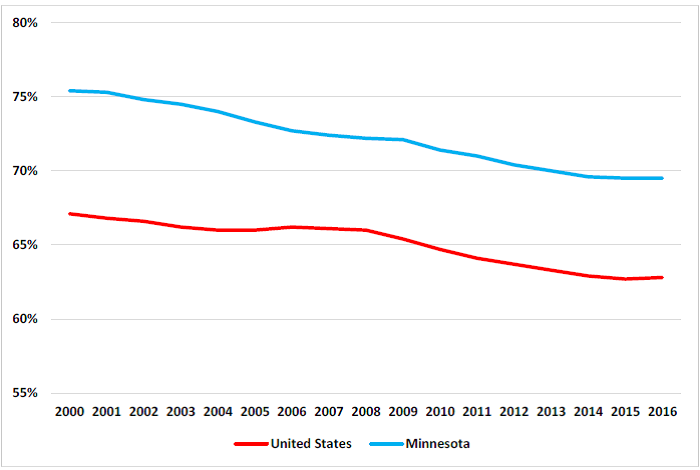
Source: Bureau of Labor Statistics
The prospects for Labor Force Participation in Minnesota
The outlook here is not good, as Figure 23 shows. The decline in Labor Force Participation shown in Figure 2 has been driven largely by the retirement of Baby Boomers. As this trend continues, the Participation Rate will continue to decline. The Minnesota State Demographic Center projects that the Labor Force Participation rate will fall to 64.6 percent in 2035, as shown in Figure 3.
Figure 3: Minnesota’s Labor Force Participation Rate, 2016 to 2050
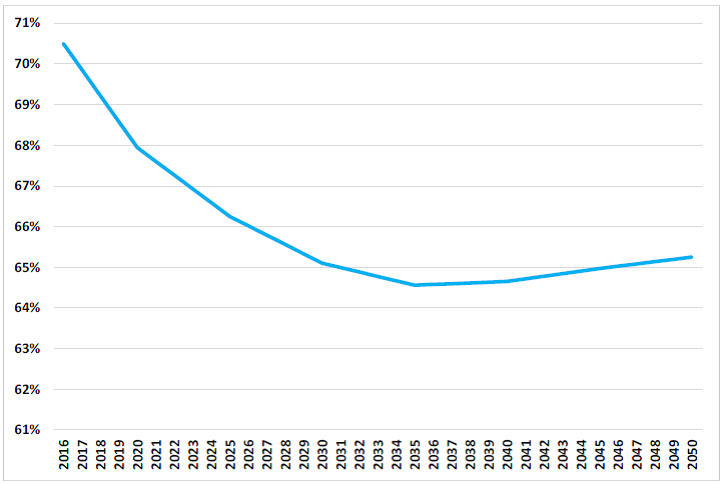
Source: Minnesota State Demographic Center
Between now and 2035, Minnesota’s percentage growth rate of Labor Force Participation is going to be a negative sign in our per capita GDP growth equation. This will act as a downward pressure on GDP per capita growth. In the next few days, we’ll look at some causes and solutions.
John Phelan is an economist at Center of the American Experiment.