Research shows that Minnesota’s taxes influence out-migration from our state
Research shows that people leave and avoid high tax states. As we explain in our new report, ‘Taxes and Migration Minnesotans on the Move to Lower Tax States,’ looking at the data for Minnesota, we see this happening in our state.
Figure 1 shows where, over the last ten years for which we have IRS data (2009-2010 to 2018-2019), Minnesota has gained residents from and where it has lost them to. The ten main sources of residents over this period were Kansas, Indiana, Ohio, Michigan, Nebraska, Wisconsin, New York, North Dakota, Iowa and Illinois. The net gain of 11,674 residents from Illinois over this decade is especially striking: it is nearly double the gain from second-place Iowa. The ten leading destinations for Minnesota residents over this period were California, South Carolina, Oregon, Georgia, North Carolina, Washington, Colorado, Texas, Arizona and Florida. These ten years saw 21,956 Minnesotans on net move to Florida. In total, the states in green on Figure 1 sent 51,177 residents to Minnesota between 2009-2010 and 2018-2019 while Minnesota sent 80,450 residents to the states in red for a net loss of 29,273.
Figure 1: Net flow of domestic migrants into and out of Minnesota, 2009-2010 to 2018-2019
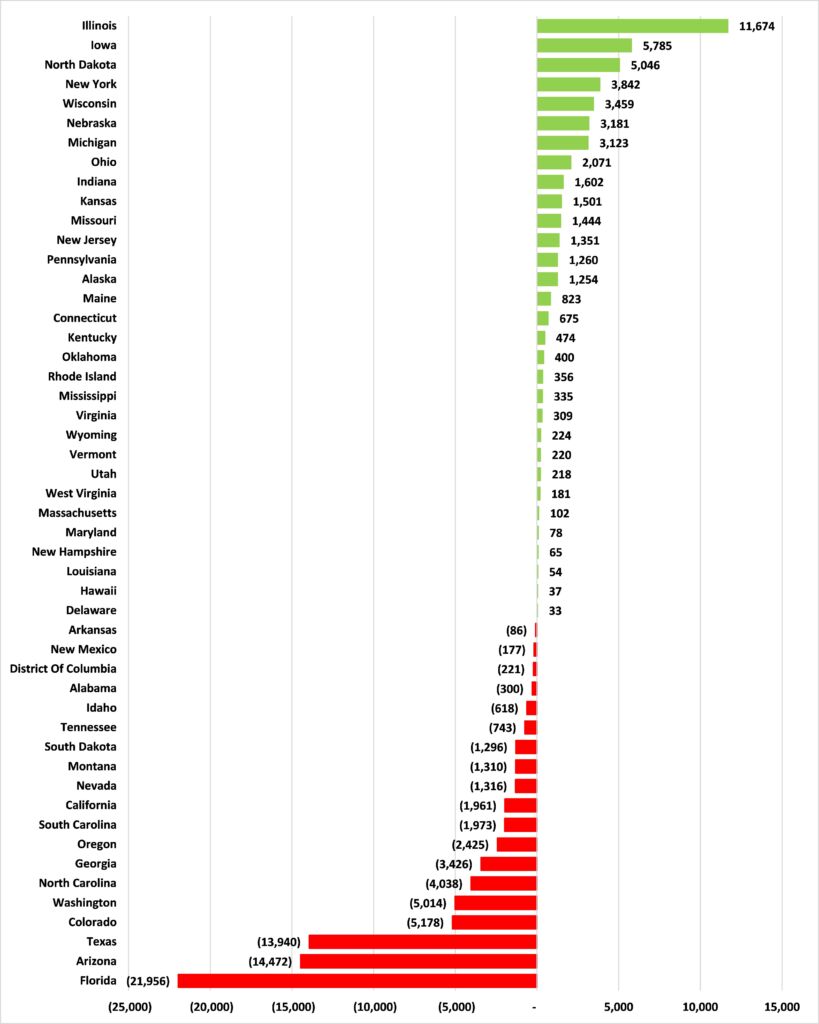
Source: Internal Revenue Service
Of course, Illinois (population 12.7 million in 2019) has more people to send to other states than Iowa (population 3.1 million in 2019). To account for this, we can look at the ratio of Minnesota’s in-migrants from a particular state to its out-migrants to it. A ratio above 1.0 means that Minnesota gained residents from that state, a ratio below 1.0 means we lost residents to it. The ratios for these in-migrants to out-migrants for the period from 2009-2010 to 2018-2019 are shown in Figure 2.
Figure 2: Ratio of Minnesota’s domestic in-migrants to out-migrants, 2009-2010 to 2018-2019
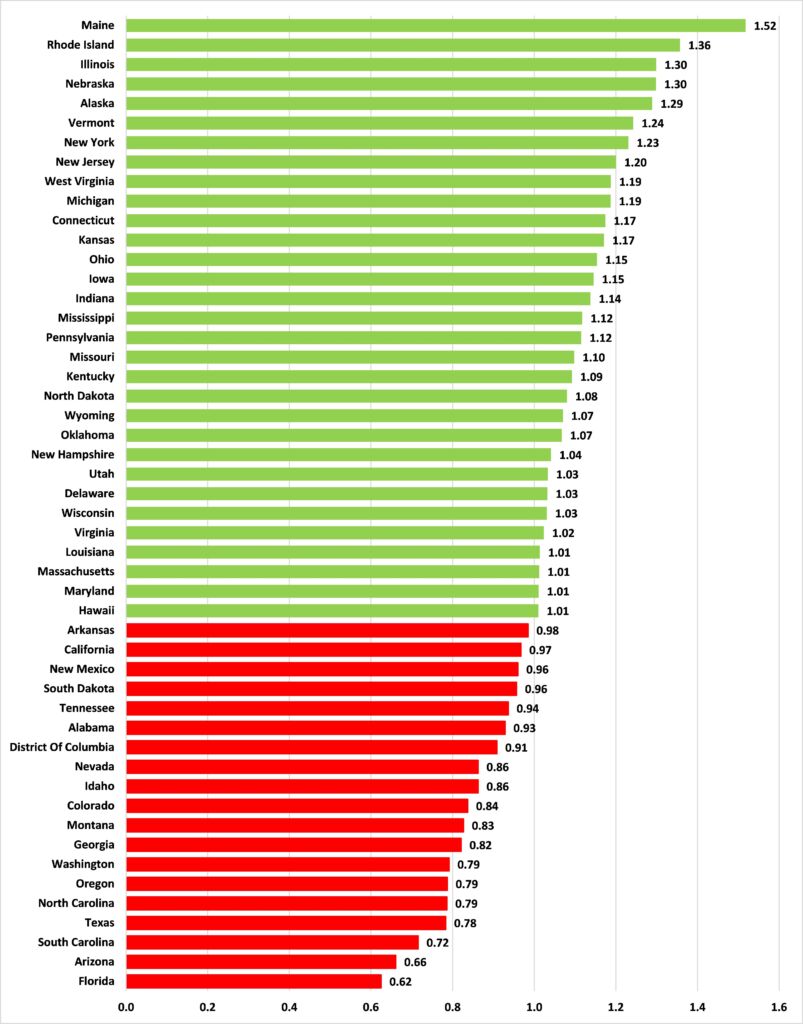
Source: Internal Revenue Service
Figure 3 shows the average burden of state and local sales, property, and individual income taxes as a share of Personal Income in the 49 other states and the District of Columbia for the period 2009 to 2018. Over this period, just seven jurisdictions (highlighted in red) had tax burdens higher than Minnesota: New Jersey, Rhode Island, Maine, Vermont, Hawaii, the District of Columbia and New York.
Figure 3: Average burden of state and local taxes as a share of Personal Income, 2009-2018
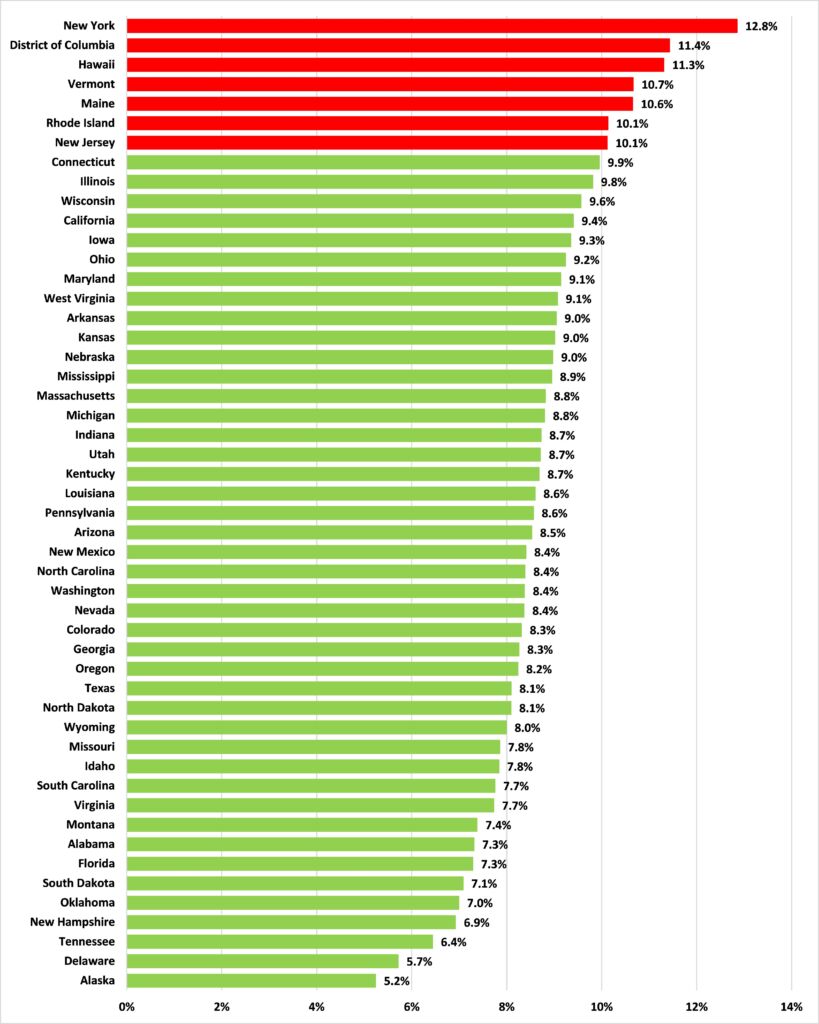
Sources: Census Bureau and Bureau of Economic Analysis
It is striking that five of these jurisdictions with tax burdens higher than ours, New Jersey, New York, Vermont, Rhode Island, and Maine, were among the top ten sources of domestic migrants to our state over the period 2009-2010 to 2018-2019, as measured by the ratio of residents moving in to residents moving out. Indeed, a broad look shows that the average tax burden over this period of the top ten sources of migrants to Minnesota was 9.6 percent (the median was 10.0 percent) while the average tax burden of the top ten destinations of domestic migrants from Minnesota was 8.1 percent (the median was 8.2 percent).
Figure 4 shows the relationship between average tax burdens in other states over the period 2009 to 2018 (from Figure 3) and the ratio of domestic in-migrants to out-migrants over the period 2009-2010 to 2018-2019 (from Figure 2). We see a positive relationship between the tax burden in a state and the ratio of in-migrants to out-migrants from that state to Minnesota: in other words, the higher the other state’s tax burden the greater, on average, the ratio of in-migrants to out-migrants and the lower the other state’s tax rate the lower the ratio of in-migrants to out-migrants. Put more simply, the lower (higher) the tax burden in the other state the greater our migration loss to (gain from) it.
Figure 4: Tax burdens and Minnesota’s net migration rates
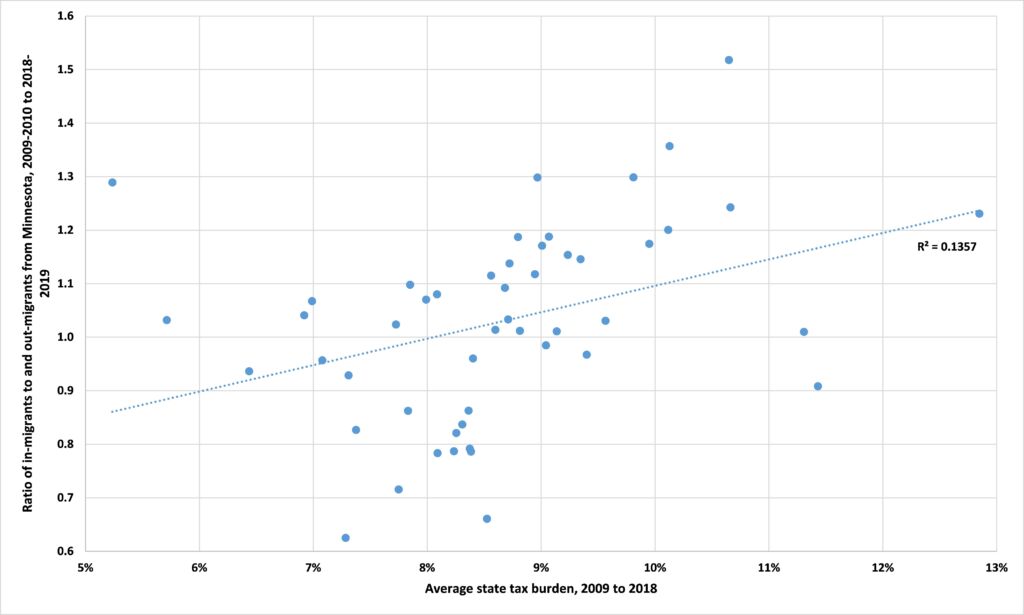
Source: Center of the American Experiment
To see whether this relationship is ‘significant’ — i.e., whether or not the apparent relationship between tax burdens and the migration patterns we see is causal (deterministic) rather than the result of randomness (stochastic) — we can calculate a p-value. A lower p-value indicates a stronger relationship and the rule of thumb is that p-values less than 0.05 indicate a relationship strong enough to be noteworthy. For our data set, the p-value is 0.000, indicating a highly significant relationship between state tax burdens and migration patterns. R2 measures what fraction of variations in the outcome variable — migration patterns — is explained by variations in the factor variable — state tax burdens. For the data in Figure 11, the R2 is 0.1357, meaning that 13.6 percent of the variation in migration ratios can be attributed to variations in state tax burdens.