The middle class is shrinking because people are getting richer
In an effort to push for policies that will redistribute wealth from the wealthy, politicians keep saying that the middle class is shrinking. According to these politicians, the middle class is saddled with taxes that high-income earners or corporations tend to escape. Politicians also claim that the middle class has not been able to share in the benefits of economic growth as those have mostly accrued to the very wealthy. Ergo, people in the middle class have been getting poorer, leading to the middle class’s shrinking size.
The numbers, however, do not support this. Indeed, the middle class is shrinking. But this is only because people are moving up the income ladder. According to a recent report
…while the benefits of economic growth have not accrued equally, they have not gone solely to the top 1 percent. The upper-middle class has grown.
…..the main reason for the shrinking of the middle class (defined in absolute terms) is the increase in the number of people with higher incomes.
Generally, the share of people in the top-income category has grown while the percentage of people with low incomes has declined.
Literature on the shrinking middle class
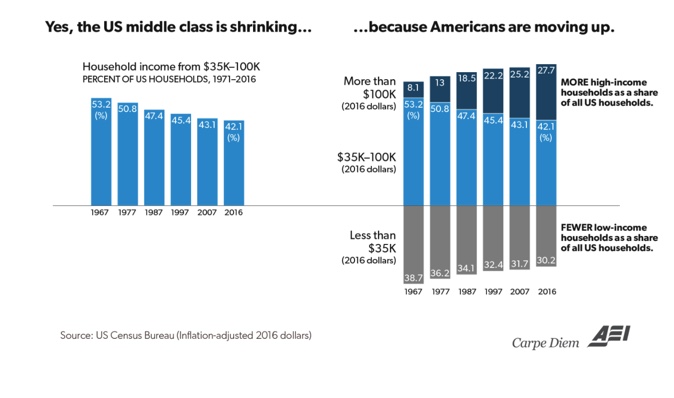
That the middle class is shrinking because Americans are moving up is supported by numerous studies. According to Cato, for example,
since 2016, the United States has had more wealthy households than middle‐class households and the share of low‐income households has reached a historic low.
As Cato explains,
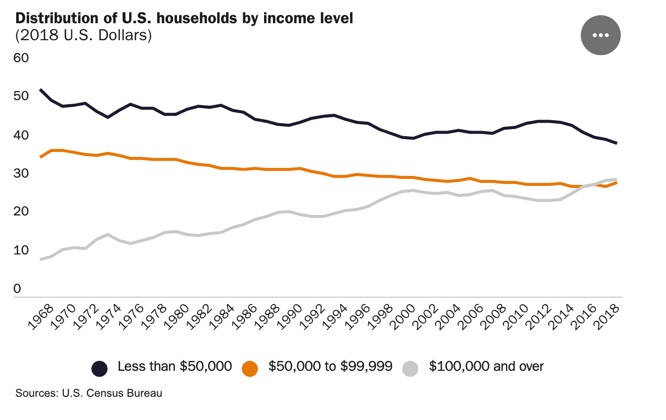
According to the most recent data from the U.S. Census Bureau, in 2018, over 30 percent of U.S. households earned over $100,000 (i.e., the upper class). Fewer than 30 percent of households earned between $50,000 and $100,000 (i.e., the middle class). The share of U.S. households making at least $100,000 has more than tripled since 1967, when just 9 percent of all U.S. households earned that much (all figures are adjusted for inflation).
In 2018, the share of households earning less than $50,000 (i.e., the lower class) dropped below 40 percent for the first time since the U. S. Census data on this metric started to be collected in 1967. Back then, 54 percent of households earned less than $50,000.
Brookings Research
Research that deals with mobility and inequality generally uses cross-sectional data that compares different individuals or households at one particular point in time. Because people are always moving between income groups, cross-sectional data gives an incomplete picture of actual mobility.
A new report from the Urban Institute solves this problem by relying on longitudinal data which tracks the same people over different periods of time. This gives a better idea of income mobility over time.
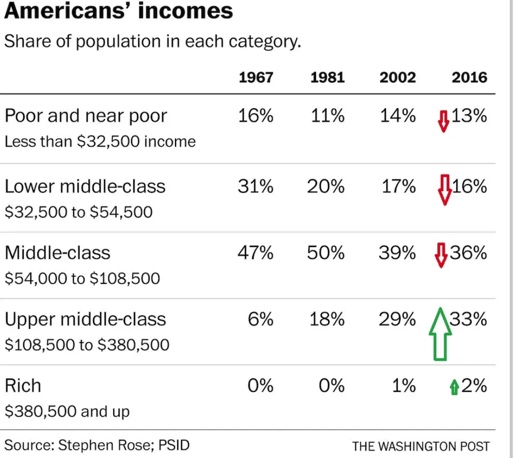
For the study, the author divides people into 5 income levels (in 2018 $) for a family of three. These groups are
i) Poor and Near Poor (PNP): <$32,500 (or 150 percent of the Federal Poverty Level)
ii) Lower middle-class (LMC): $32,500 to $54,500 (150 to 250 percent of the Federal Poverty Level)
iii) Middle middle-class (MMC): $54,500 to $108,500 (250 to 500 percent of the Federal Poverty Level)
iv) Upper-middle-class (UMC): $108,500 to $380,500 (500 to 1750 percent of the Federal Poverty Level)
v) Rich: >$380,5001
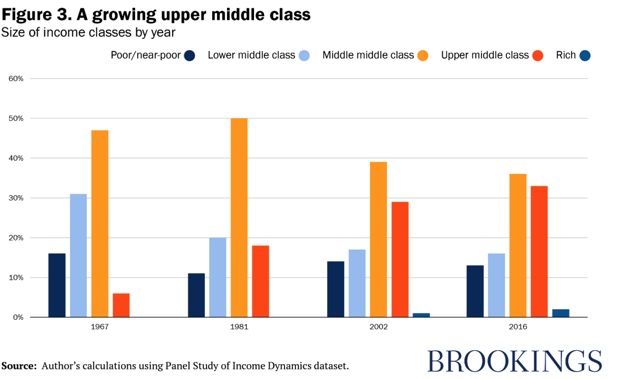
The study finds that
…the higher income classes expanded significantly during the first period. Between 1967 and 1981, the upper middle class tripled in size (from 6% to 18%) and the MMC grew by 3 percentage points (from 47% to 50%). Offsetting these gains were a corresponding shrinkage of the lower middle class (LMC) from 31% to 20% and the poor/near-poor (PNP) from 16% to 11%.
Conclusion
A shrinking middle class is a bad thing if people are getting poor. However, this is not the case in the United States. Contrary to claims by politicians, the middle class is shrinking because people are getting richer, not poorer.