What are models, how do we build them, and how do they work?
I’ve written a lot recently about the huge economic cost of the Coronavirus shutdown. The Governor’s policy is being guided by a model built by the University of Minnesota and the Minnesota Department of Health which forecasts mortality from Covid-19 and peak ICU demand under a number of scenarios. Given its central place in state policy making at present, it is worth reflecting on what such a model is, how it is built, and how it is used.
How and why do we build models?
All models, whether they are economic, climactic, or epidemiological, are constructed in essentially the same way.
First, you identify some y variable, such as income per capita, global temperatures, or mortality caused by Covid-19, the effects upon which of changes in other variables you want to try and quantify. Next, you identify these ‘other’ x variables which are assumed to drive it, such as employment growth, atmospheric CO2, or the reproduction number (R0). Then, you construct a series of causal relationships between these variables. Finally, you quantify these relationships and run your model. This gives an estimate of how changes in one or more x variable will change the y variable.
A very simple example of this can be found in my recent report, Minnesota’s Workforce to 2050. I wanted to show what effect slowing population growth would have on the state’s per capita GDP. I assumed that per capita GDP growth could be found by the equation:
Total employment x Average labor productivity = GDP per capita
Population
So, to find the values for future years, I plugged in population forecasts taken from the state demographer, estimates of future growth in labor productivity from the Congressional Budget Office, and employment numbers generated by applying an average of employment levels over recent years to the future population estimates. This very basic model produced estimates of Minnesota’s GDP per capita out to 2045.
How do you use a model?
If any of these forecasts for population or productivity are updated, or if better ones become available, I can go back and re-calculate the numbers. This is an important point, especially in the case of Covid-19.
This is a brand new disease, the first identified case comes from November. We are learning new things about it all the time. As a result, our model inputs are changing. And, as a result of that, the model outputs are changing all the time.
So, on April 8th, Gov. Walz announced that he was extending Minnesota’s stay-at-home order (SHO) to May 4th. On April 10th, in a closed briefing for the media, state health officials unveiled the thinking and data modeling behind this decision. They used a new model, v.2, which incorporates “Refinements” to the previous model which “Drive Changes in Estimates”. These refinements included:
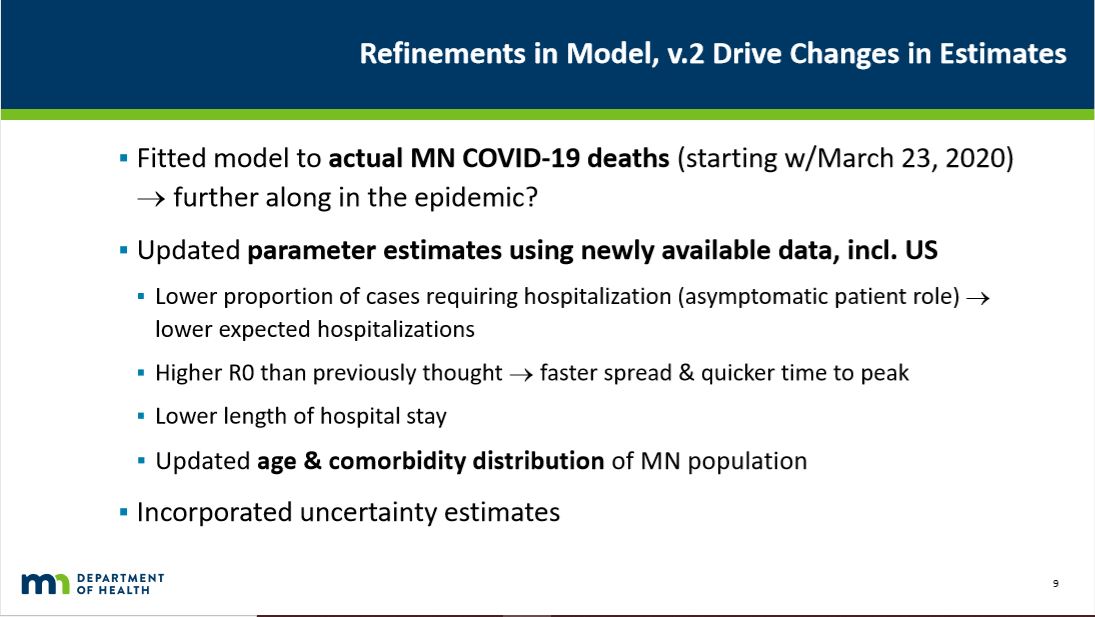 The “Updated parameter estimates” reflected “newly available data, incl. US”. For example, the Star Tribune reported:
Length-of-stay in intensive care was originally set at 23 days, but was reduced in the latest modeling to 13 days based on U.S. experience in treating COVID-19. That alone means more estimated bed capacity for COVID-19 patients.
When you hear people say that we must listen to what ‘the science’ says, fine, but as science grapples with this brand new disease what it is saying changes over time. And so it should. Science, after all, is not a fixed body of unchangeable, unchangeable knowledge. That is dogma. Science is a mode of inquiry driven by skepticism. As the Russian science fiction writer Isaac Asimov is supposed to have said:
The most exciting phrase to hear in science, the one that heralds new discoveries, is not “Eureka” but “That’s funny…”
Tomorrow, we’ll look at what this new version of the model said.
John Phelan is an economist at the Center of the American Experiment.