White House ‘fact’ sheets give states flawed uninsured projections
Last week the White House released separate facts sheets for each state to highlight how the Inflation Reduction Act (IRA) will lower health care costs and improve health coverage in each state. A key “fact” for each state provides a projection for how many people in the state will now have health insurance compared to a future without the IRA. These state-level projections are far from a fact and, instead, are entirely unreliable numbers sourced from a flawed report published by the Assistant Secretary for Planning and Evaluation (ASPE) within the Department of Health and Human Services (HHS).
These are the sorts of sales flyers any presidential administration can be expected to publish to promote their policies. It’s also expected that ASPE staff would pursue research and publish reports related to the administration’s policy priorities. What’s unexpected is how the Biden administration used the data crunchers at ASPE in coordination with economists from the RAND Corporation to create state-level insurance coverage projections that they must know are not reliable.
Background
The American Rescue Plan Act of 2021 (ARP) expanded federal premium tax credit subsidies by (1) making them more generous to people who already qualify and (2) extending eligibility to people who earn more than 400 percent of the federal poverty level (FPL). However, this expansion was temporary and set to expire at the end of 2022.
This premium subsidy expansion substantially increased the number of people enrolled in the individual health insurance market with premium subsidies through Exchanges. Other federal policies related to the pandemic response also impacted the number of people who are enrolled on Exchanges with premium subsidies. This includes two key policies. First, the Biden administration established special enrollment periods that allow people to enroll in subsidized coverage outside the annual open enrollment period. Second, the Families First Coronavirus Response Act required states to keep people continuously enrolled in Medicaid in return for an enhanced match in federal funding. This resulted in a dramatic expansion in Medicaid enrollment, increasing from 73 million in April 2020 to 88 million in April 2022. Keeping millions continuously enrolled in Medicaid diverted large numbers of people from enrolling in subsidized coverage through Exchanges.
The IRA President Biden signed last week extended the ARP premium subsidy expansion by 3 years. Earlier this year, ASPE published a report that projected state-level coverage and subsidy impacts if the ARP premium subsidy expansion were allowed to sunset in 2023. This includes a state-by-state estimate of the number of people who would go uninsured, which is what the White House used in the fact sheets to tout the number of people in each state who will “gain coverage” thanks to the IRA.
State-Level Projections Claim Broad Coverage Gains in Every State
The ASPE projections are based on an analysis from both ASPE and RAND using the RAND COMPARE microsimulation model. As ASPE admits, “COMPARE is designed to produce national-level policy estimates.” As a result, the state estimates “do not account for state-specific factors that may impact the effects of ending ARP premium tax credit provisions.” Therefore, the analysis simply allocates the national enrollment estimates to each state based on each state’s share of national enrollment on ACA Exchanges during the 2022 open enrollment period (OEP).
Nationally, the COMPARE model projected nearly 3 million people would become uninsured if the premium subsidy expansion were to sunset in 2023. By allocating this national projection to each state based on Exchange enrollment, this methodology ensures the coverage loss will be broad-based. In turn, with the IRA now signed, the White House can now conveniently claim the coverage gains will be broad-based across every state. But these coverage gains won’t come close to being broad-based.
Report Acknowledges Limitations
ASPE and RAND document several limitations to their methodology. As already noted, it does not account for state-specific factors. These factors, according to ASPE, might include state-funded subsidy enhancements or state-specific economic factors, such as employment or wage growth trends and the income distribution of subsidy eligible people. It also assumes Exchange unsubsidized enrollment reflects the off-Exchange unsubsidized population. Finally, it admits projections of subsidized individuals might not be directly comparable to plan selections made during the open enrollment period.
Acknowledging these limitations may appear to be an honest effort to be transparent. The authors are clearly admitting the actual experience could be different if the methodology accounted for these limitations. However, by acknowledging the limitations and still publishing the projections, they are still taking the position that the projections are in the ballpark and provide meaningful, actionable information. They are essentially admitting to using a sophisticated microsimulation model to provide a back-of-the-envelope projection.
Back-of-the-envelope projections are fine when time or data limitations prohibit something more accurate. However, even back-of-the-envelope projections—especially when published by a government agency—must still reflect a plausible scenario. If not, then methodology is likely flawed. So, if there is reason to believe a projection is not plausible and the methodology is flawed, then it’s completely irresponsible to suggest otherwise. Yet, that appears to be exactly what ASPE and RAND did.
State-Specific Projections Do Not Square with Prior Enrollment Experience
National enrollment through Exchanges proved remarkably stable in the years leading up to the pandemic. Average monthly effectuated enrollment—the people who select a plan and pay their premium—ranged from 9.8 to 10.0 million between 2016 and 2019. Starting from such a stable base, it’s easy to identify how COVID and COVID-related policies impacted Exchange enrollment when the new data for 2020 onward arrived.
Comparing the pre-pandemic 2020 OEP to the 2022 OEP shows plan selections increased by 3.1 million after the pandemic hit and the ARP premium subsidy expansions were implemented. That increase in plan selections is nearly identical to the 3.0 million who ASPE and RAND project would lose coverage and go uninsured. Thus, the COMPARE model returned an entirely plausible national coverage projection. Obviously, if 3.1 million additional people selected plans after premium subsidies expanded, we can expect around 3 million fewer after the policy goes away. That’s what the Congressional Budget Office (CBO) assumed. When discussions of the expanded subsidies expiring surfaced last year, they concluded, “For 2023, CBO and JCT anticipate that some of the estimated increase in enrollment would persist beyond 2022, when the enhanced subsidy structure prescribed by this legislation would expire, and would gradually return to current law levels by 2024.”
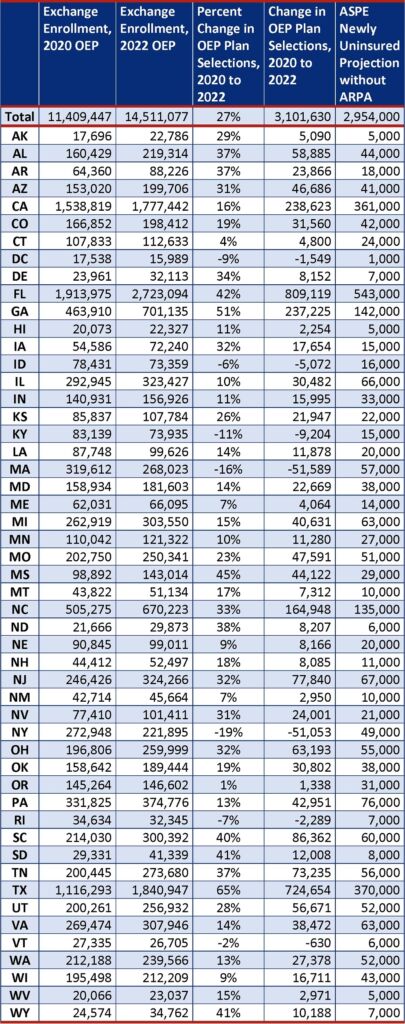
However, as the following table reveals, allocating this plausible national result uniformly across states using ASPE and RAND’s simplistic methodology does not produce plausible state-specific projections. The table includes two columns from the ASPE report: the 2022 OEP enrollment data and the projected number losing individual coverage and becoming uninsured. The table then adds 2020 OEP enrollment data and shows the change in enrollment between the 2020 OEP and the 2022 OEP as both a number and percentage. Adding these data shows the dramatic differences in how enrollment changed from state to state after ARP expanded premium subsidies in 2021. Enrollment actually declined in six states and the District of Columbia. Enrollment increases ranged between 1 percent in Oregon and 65 percent in Texas. The remaining 42 states are scattered rather evenly from a 4 to 51 percent increase.
All of this real-world variation in Exchange enrollment that happened immediately after ARP expanded premium subsidies shows just how much state-specific factors drive state-level enrollment patterns. By just acknowledging state-specific factors as a mere limitation, ASPE and RAND suggest it simply limits how well the methodology works. Yet the powerful influence of state-specific factors revealed by how real-world state enrollment patterns responded to ARP shows the methodology just doesn’t work at all. When experience shows there was no uniform state-level enrollment impact from expanding premiums subsidies, it is entirely unreasonable to assume state-by-state uniformity will occur in the future if the policy is reversed.
Change in Exchange Enrollment from 2020 to 2022 Shows Dramatic Variations Across States After Premium Subsidies Expanded in 2021
Projections Lead to Absurd Results
I originally noticed the problem with the White House fact sheets when I reviewed the Minnesota fact sheet and considered the projected coverage gains against the state’s current enrollment levels. Being from Minnesota, I’m more attuned to the state’s insurance market and immediately knew the projection would lead to an absurd result. In recent years enrollment through MNSure—Minnesota’s state-based Exchange—has been in the neighborhood of 100,000 and, as of June, is close to 110,000. If 27,000 subsidized Minnesotans were to go uninsured next year, then enrollment would drop to roughly 80,000.
It’s absurd to think MNSure enrollment would drop to 80,000—a roughly 20 percent drop—after it had risen and stabilized for several years at 100,000 before the pandemic and before the expanded subsidies. The table shows several other states—e.g., Idaho, Oregon, New York, Rhode Island, and Kentucky—that would end up with similarly absurd enrollment reductions compared to pre-pandemic enrollment levels. Nonetheless, that is the result when you use the projections from ASPE and RAND that assume a uniform allocation from a national projection.
Report Ignored Other Major Limitations and Evidence
There are several other state-specific factors that ASPE and RAND never mention which help explain why expanding premium subsidies in 2021 impacted each state so differently. Some states chose not to expand Medicaid which changes the enrollment dynamics in several ways. Two key factors drove higher enrollment gains in non-expansion states. First, people with incomes between 100 and 138 percent of FPL in expansion states qualify for Medicaid and, therefore, do not qualify for premium subsidies. Thus, broader income eligibility in non-expansion states broadens the number of people who benefit from more generous subsidies. Second, the more generous subsidies are especially motivating at this income level because it broadened access to zero-dollar premium plans. With broader access to free plans, people with incomes between 100 and 150 percent of FPL experienced the highest percent gain in enrollment of any income level from the 2020 to the 2022 OEP. So, there are more people eligible to benefit in non-expansion states and they are more motivated. With these two factors in mind, it’s no coincidence that the seven states with the largest percentage enrollment gains listed in the previous table are all non-expansion states.
In addition to Medicaid expansion, Minnesota and New York established basic health programs that cover people with incomes from 100 to 200 percent of FPL. This carves out a much larger share from the individual health insurance market and disqualifies them from premium subsidies. Thus, people enrolled in these programs did not directly benefit from the more generous premium subsidies. That helps explain Minnesota’s more modest enrollment gain and New York’s 19 percent enrollment drop.
The extreme variation in the cost of premiums from state-to-state also drove substantial variation. Based on 2022 OEP data, average premiums for plans selected ranged from $408 in Utah to $1,144 in West Virginia. In states with higher premiums, the premium subsidy expansion made premiums substantially more affordable for people with incomes above 400 percent of FPL. In lower-premium states, the subsidy expansion did nothing to help large numbers of people with incomes above 400 percent of FPL. That’s because they already had access to affordable benchmark premiums that cost less than 8.5 percent of their income, which is the threshold to qualify for premium subsidies. Obviously, we should expect no enrollment impact if the policy sunsets for these people. So, it’s no surprise that 8 of the 10 states with the lowest premiums this year also experienced below average enrollment gains.
It’s also worth noting that ASPE and RAND fail to mention OEP plan selection allocations are not directly comparable to actual enrollment. They relied on OEP enrollment data for their state-specific allocation formula which reflects the number of “plan selections” made during the OEP. Not everyone who makes a plan selection follows through and “effectuates” enrollment by paying their premium. As a result, there can be substantial attrition from the number of people who select a plan to the number of people who enroll and pay premiums throughout the year. For instance, the pre-pandemic 2019 attrition rate was 27 percent in Tennessee compared to 5 percent in Rhode Island. By not accounting for this attrition, their allocation formula exaggerates the Tennessee share and short changes the Rhode Island share. While OEP plan selections might still be okay for a back-of-the-envelope allocation calculation, it still layers on another state-specific factor that impacts the allocation of coverage impacts across states.
Conclusion
When ASPE and RAND drafted their report, they certainly knew state enrollment changes across the country varied dramatically in response to ARP’s expansion of premium subsidies in 2021. Yet, when they assessed the impact of reversing this policy, they ignored this variation. Instead, they published projections that assumed the pain from coverage losses would be uniformly distributed across every state in the country.
This served an important political purpose at the time. It allowed the Biden administration and its allies to claim that all states would suffer coverage losses if the premium subsidy expansion ended. Now they’ve used it to claim that all states are benefiting from coverage gains thanks to Biden signing the IRA. But the truth is, several states never experienced much, if any coverage gains from the policy. The biggest actual enrollment gains occurred in states like Texas, Georgia, Mississippi, Florida, Wyoming, and South Dakota. The report’s uniform allocation methodology understated the gains in these deeper red states to help influence more swayable areas of the country.
It’s no surprise that ASPE is working with contractors from RAND to develop and report data to support the Biden administration’s policies. That’s part of their job. But it is a surprise they put their names to a report with such a weak (and easy to expose) methodology steered to a political result. Indeed, RAND’s tagline sells itself as providing “Objective Analysis.” So, it’s an even bigger surprise that they are letting their COMPARE microsimulation model be used to serve objectively flawed research.