Minnesota’s hard working labor force masks below average worker productivity
Last week, I wrote about how Minnesota’s high rates of GDP (or Personal Income) per capita relative to the rest of the US can give a misleading impression of the state’s economic health. These figures reflect the fact that Minnesota has a greater share of its people working then most other states. This obscures the fact that Minnesota’s workers are, on average, less productive than those in other states. And for living standards it is productivity that is important.
From a numeric example to the real world
I included a numeric example last week. I showed two hypothetical states; State A had a low labor force participation rate (50%) but higher productivity (2 units of GDP per worker). State B had a higher labor force participation rate (75%) but lower productivity (1.5 units of GDP per worker). As a result, despite having a lower level of GDP per worker, State B has a higher level of GDP and GDP per capita.
So much for hypotheticals, you might say. Fortunately, using data from the Bureau of Economic Analysis, we can put actual names to States A and B.
First, we can take the BEA’s estimate of 2016 GDP for each state and divide it by the population (table SA1) to get an estimate of GDP per capita, as shown in Table 1. Minnesota performs well on this measure. We rank 14th, comfortably above the national average. States with below the national average GDP per capita are shaded orange.
Table 1: GDP per capita by state, 2016
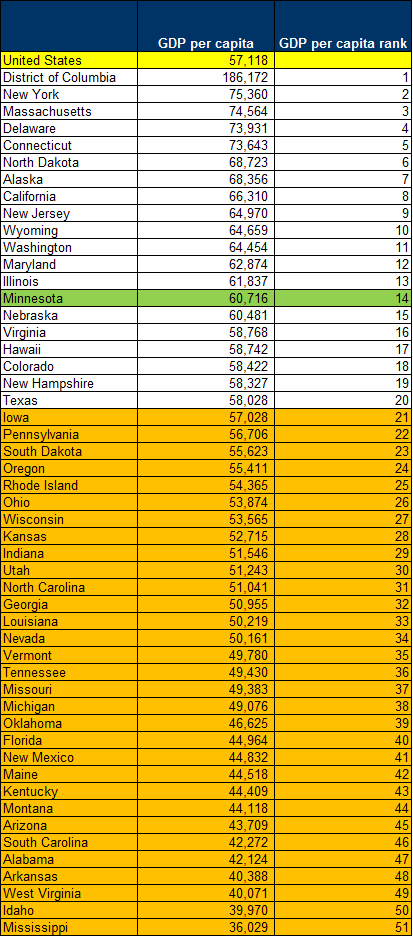
Source: Bureau of Economic Analysis
Next, we can divide the BEA’s estimate of 2016 GDP for each state by the Total employment in that state (SA4) to get an estimate of GDP per worker, as shown in Table 2. Here, Minnesota does less well. We rank 19th overall, but lag the national average fairly substantially. States with below the national average GDP per worker have red text.
Table 2: GDP per worker by state, 2016
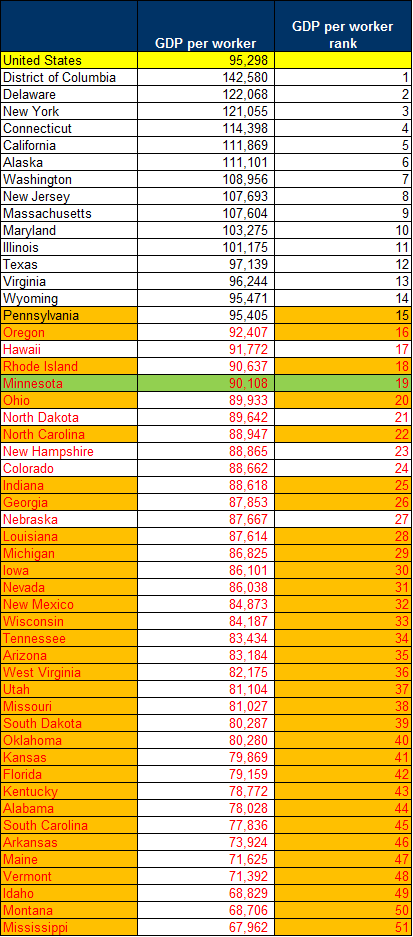
Source: Bureau of Economic Analysis
So how do we square Minnesota’s strong performance on GDP per capita with its relatively weak performance on GDP per worker? Simply put, a greater share of Minnesotans are working.
Taking data for Total employment (SA4) and population (SA1), we can divide the one by the other to get a Labor Force Participation Rate, as shown in Table 3. We can see that Minnesota ranks eighth in the US, well above the national average. States with below national average LFPs are tagged in the left hand column.
Table 3: Labor Force Participation Rates by state, 2016
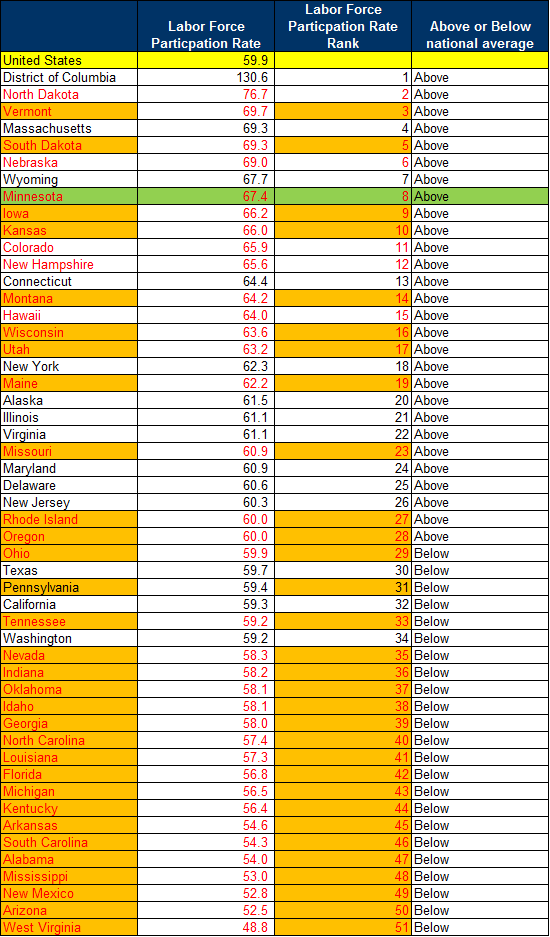
Source: Bureau of Economic Analysis
Why does the Labor Force Participation Rate matter? GDP per capita or per worker is just GDP divided by the population or the number of workers, as we’ve seen. Given that not all of your population will be employed, we can expect the number for GDP per worker to be higher than the number for GDP per capita because you are dividing the GDP by a smaller number or people (unless you are Washington DC, which sucks in workers from neighboring states). But in states with high Labor Force Participation Rates, like Minnesota, the difference is not that great.
Who are the As and who are the Bs?
But with our brightly colored tables we are now able to see which states are the As and which are the Bs. State As will have black text, be shaded orange, and be tagged ‘Below’ in Table 3. They are Pennsylvania, in other words. State Bs will have red text, be shaded white (or green), and be tagged ‘Above’ in Table 3. They are North Dakota, Nebraska, Minnesota, Colorado, New Hampshire, and Hawaii.
So Minnesota should be more like Pennsylvania? Not quite…
This isn’t to say that State As have got it right and State Bs wrong. A productive labor force, as State As have, is a good thing. A high Labor Force Participation Rate, as State Bs have, is a good thing also. Tomorrow I’ll look at what it might mean for Minnesota to be a little – but not a lot – more like an A state than a B state.
John Phelan is an economist at Center of the American Experiment.
For more information about the Minnesota economy, see out new report, The State of Minnesota’s Economy: 2017.