Personal Income growth in Minnesota is driven by increases in transfer payments and shows our state’s poor performance on productivity
In our new report, The State of Minnesota’s Economy: 2017, we take a thorough look at our state’s economic health and the prospects for the future. The third point we make is that Minnesota’s impressive gains in personal income since 2000 have come disproportionately from increases in transfer payments.
Minnesota’s personal income growth rate lags the national average
GDP and productivity are important starting points, but people experience the economy through their income and spending. What does the data tell us about Minnesotan incomes?
There is state level data on Personal Income by component going back to 1929. This measures the total income people receive from all sources; labor (Net earnings by place of residence), capital (Dividends, interest, and rent), and transfers such as Social Security (Personal current transfer receipts).
Figure 1 shows that since 2000, Minnesota’s rate of real per capita Personal Income growth has been at about the national average (this is Figure 7 in our report). In 31 states, the growth rate has been higher. As we noted on Tuesday, this isn’t a result of economic convergence between poorer areas and already rich areas like Minnesota. Over the period covered by our report, there has been no convergence.
Figure 1: Real per capita Personal Income growth, 2000 to 2016, %
![]()
Source: Bureau of Economic Analysis
Minnesota’s increase in Personal Incomes has been driven by a rise in transfer payments
The data allows us to look at the composition of Personal Income over time to see how the shares of the three categories have changed.
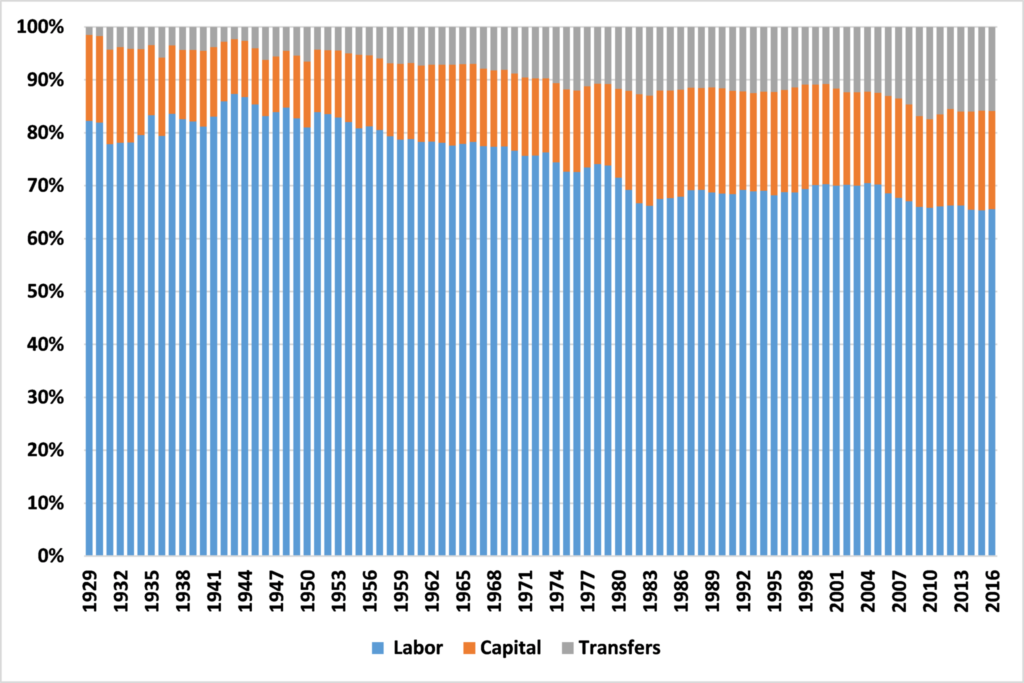
Figure 2 shows the changing composition of Personal Income in Minnesota since 1929. For the first three decades, labor income accounted for an average of 82.3% of Personal Income. It has not accounted for that much in any subsequent year and was 65.6% in 2016. By contrast, the share of Personal Income derived from transfer payments has risen from an average of 4.4% in the first three decades to 15.9% in 2016. These trends are very similar for the US as a whole.
Figure 2: Minnesota’s Personal Income by source, 1929 to 2016, %
Source: Bureau of Economic Analysis
But this national trend has been more pronounced in Minnesota in recent years.
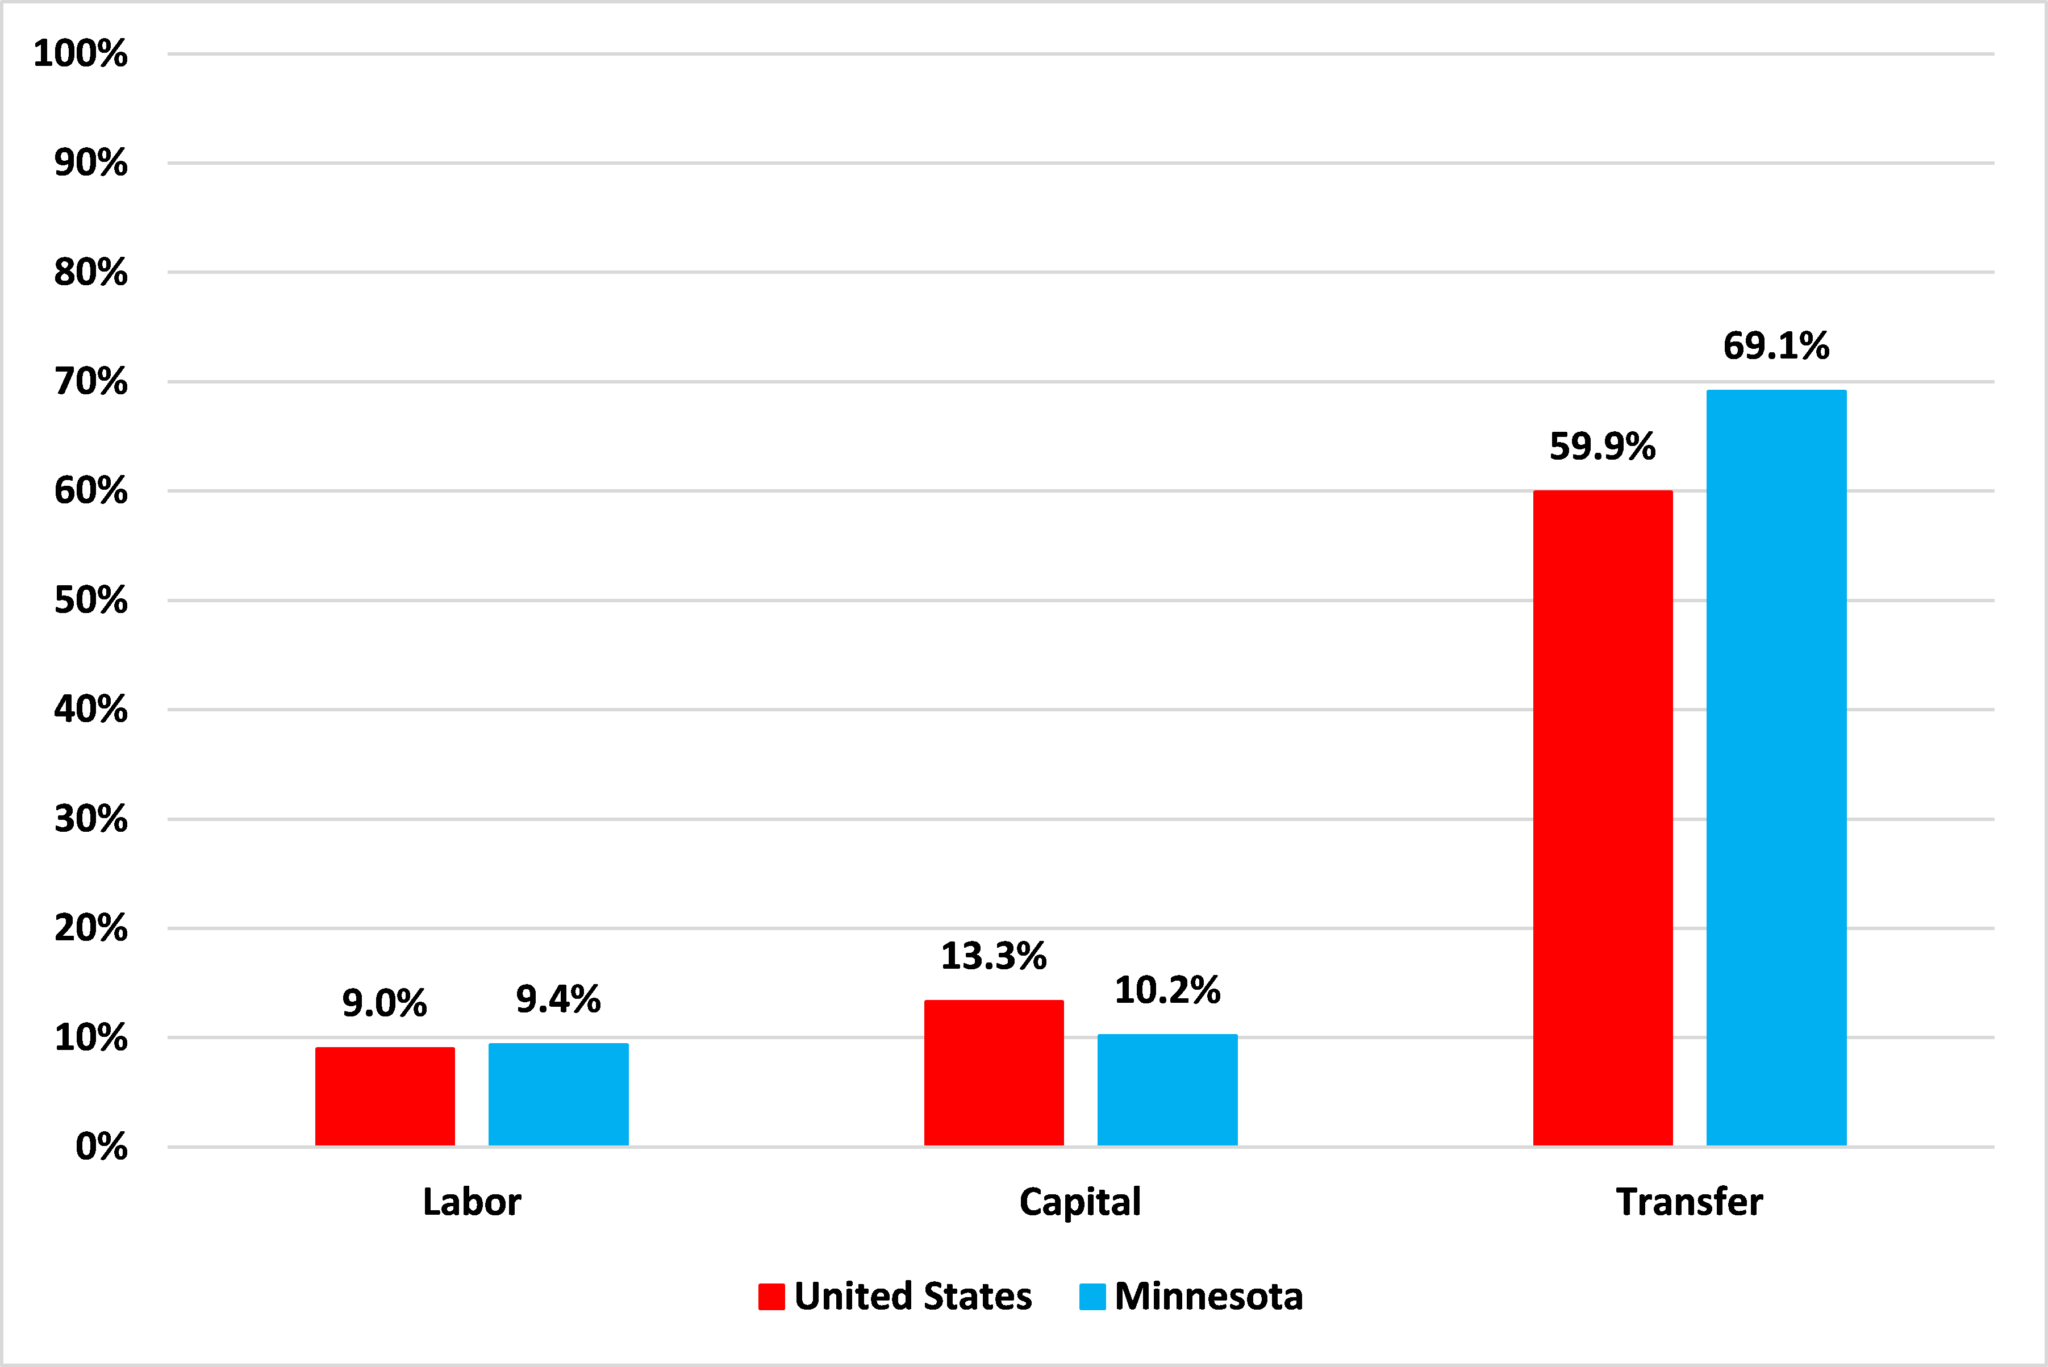
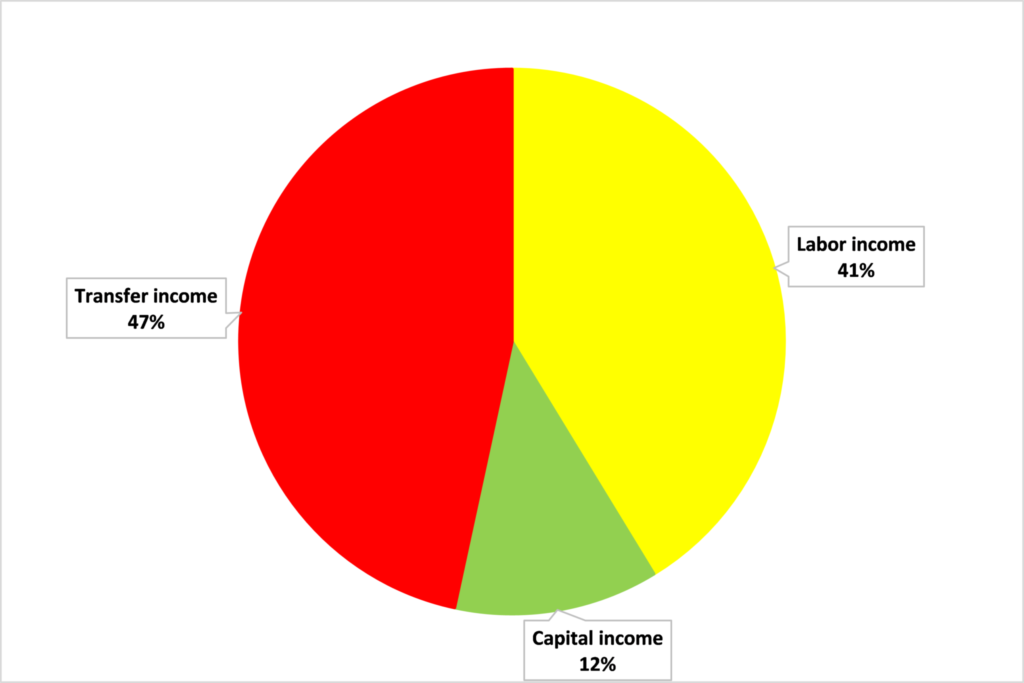
On a per capita basis, Minnesotan’s Personal Income was 5.7% above the national average in 2016. Income from labor and capital are also still ahead of the national average, and income from transfers is below. But, as Figure 3 shows (which is Figure 9 in our report), since 2000, growth in income from transfers was 69.1% in Minnesota and 59.9% nationally. Indeed, as Figure 4 shows (Figure 10 in our report), of the increase in Minnesotan’s Personal Incomes since 2000, 47% came from increases in transfer income.
Figure 3: Real per capita Personal Income growth by source, 2000 to 2016, 2009 dollars
Source: Bureau of Economic Analysis
Figure 4: Sources of growth of real per capita Personal Income by source, 2000 to 2016, 2009 dollars
Source: Bureau of Economic Analysis
Increasing the transfer share of income is unsustainable
Income received in return for performing labor or renting out capital is good, from an economic perspective. It is income received in return for producing goods or services, and the production of goods and services is what GDP measures. More of this means higher GDP.
Transfer income, by contrast, is not received in return for productive activity. For the transfer of income to take place, the income must first be generated by the productive economic activities of labor and capital. These transfers may be deemed necessary, but it is a worrying sign, both nationally and at the state level, that they comprise an ever growing share of American incomes. Quite simply, this trend is unsustainable.
More work, but not more output
Still, the fact remains of Minnesota’s above average per capita Personal Income. But, as we’ll look at in more depth next week, much of this is because there are a greater number of Minnesotans working. Per capita Personal Income is like per capita GDP, it is just Personal Income divided by the population. The more of that population that is working the more Personal Income (or GDP) there will be to divide between the population.
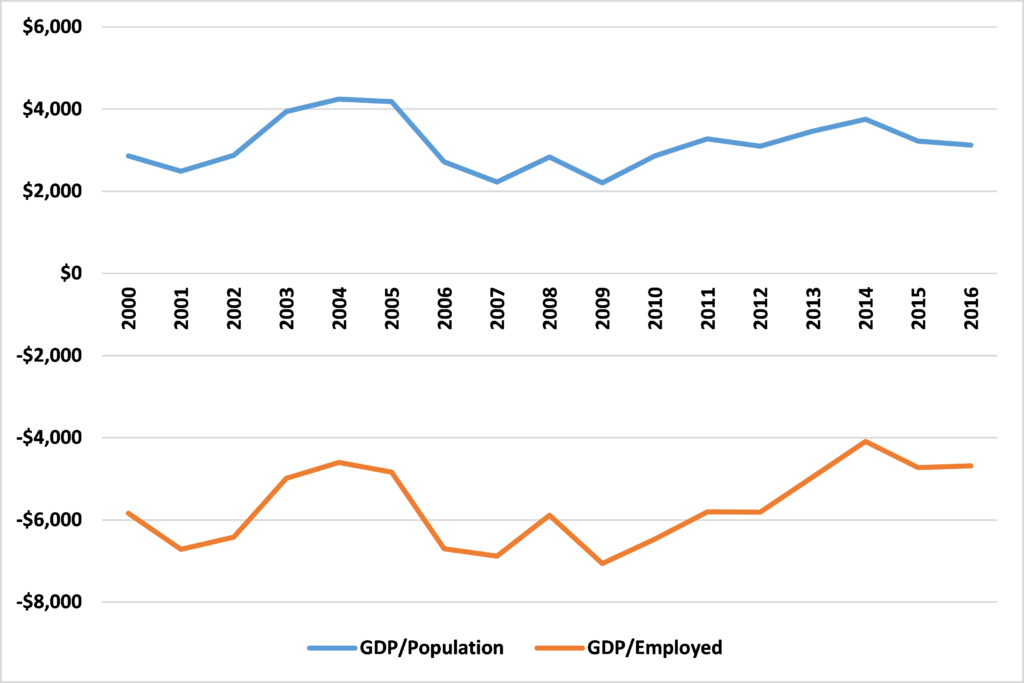
In math terms, GDP or Personal Income (which is some components of GDP) is the numerator and population or labor force is the denominator. If we divide Minnesota’s GDP by the population to get per capita GDP, as we do in Figure 5, we lead the national average. But if we divide Minnesota’s GDP by its workforce, a smaller denominator, to get per worker GDP, we lag the national average. This shows, again, that we have a state economy of below average productivity. But it also shows that we have higher than average per capita GDP and Personal Incomes because there are more of us working. (See Appendix)
Figure 5: Minnesota’s real GDP divided by population and employed, relative to the US, 2000 to 2016, 2009 dollars
Source: Bureau of Economic Analysis
The point of economic activity isn’t to generate work but to generate output. Odd as it may seem, Minnesota’s above average levels of per capita Personal Income and GDP coupled with its above average labor force participation, indicate again our state’s below average productivity.
Appendix
This may seem a little counter-intuitive so a numeric example is shown below.
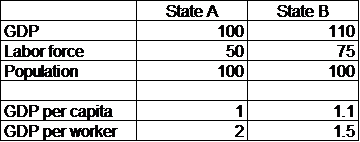
State A has a low labor force participation rate (50%) but higher productivity (2 units of GDP per worker). State B (corresponding to Minnesota) has a higher labor force participation rate (75%) but lower productivity (1.5 units of GDP per worker). As a result, State B has a higher level of GDP and GDP per capita, but a lower level of GDP per worker.
John Phelan is an economist at Center of the American Experiment.