MN Was State Least Affected by Government Shutdown
The latest federal government shutdown hardly registered a blip when it came to the effect on daily life for most folks. The inconsequential impact was partly due to the short–just three days–duration of the 19th government shutdown.
But it’s also because of where you live. Minnesota was dead last, number 51 among all the states and the District of Columbia, in a WalletHub analysis of the local effect of the brief interruption of federal government services across the country.
To determine whose homes a government shutdown strikes closest to, WalletHub compared the 50 states and the District of Columbia across six key metrics. They range from each state’s share of federal jobs and contracts to the percentage of kids covered by the Children’s Health Insurance Program (CHIP). You can check out the findings below, followed by the complete methodology used.
While Minnesota may be viewed by many as a big-government state, it’s not so in terms of the federal government. WalletHub ranks Minnesota 49th in share of federal jobs, just behind Connecticut and Wisconsin. Minnesota came in bottom of the barrel in the percentage of Children’s Health Insurance Program funding that was on the table when the budget negotiations broke down. But other factors were also taken into account.
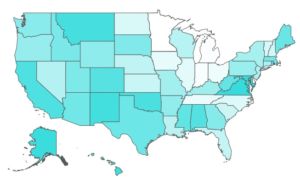
On a 100-point scale, Minnesota scored lower than any other state at 13.31. The jurisdiction with the greatest dependence on the feds and greatest impact? The District of Columbia with a rating of just over 70 points. No surprise there.
Overall, the analysis found blue states depend more on the federal government than red states, and thus took more of a hit from the abbreviated shutdown.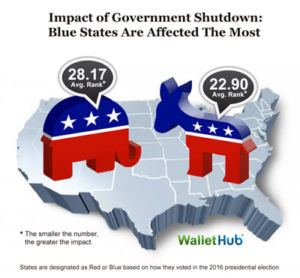
But WalletHub left it up to Minnesotans to assess another factor, the potential political fallout for those who supported the short-lived shutdown, including Senators Amy Klobuchar and Tina Smith. Most & Least Affected States
| Rank | State | Score | Rank | State | Score |
| 1 | District of Columbia | 70.42 | 27 | Pennsylvania | 30.53 |
| 2 | Maryland | 70.41 | 28 | Kentucky | 28.10 |
| 3 | Virginia | 67.67 | 29 | Missouri | 28.05 |
| 4 | Alaska | 58.29 | 30 | New York | 27.66 |
| 5 | Hawaii | 51.86 | 31 | Connecticut | 27.62 |
| 6 | New Mexico | 48.87 | 32 | New Jersey | 27.38 |
| 7 | Montana | 47.96 | 33 | Nevada | 27.01 |
| 8 | Oklahoma | 45.65 | 34 | Wisconsin | 26.78 |
| 9 | California | 44.37 | 35 | Louisiana | 26.74 |
| 10 | Alabama | 42.33 | 36 | Nebraska | 26.41 |
| 11 | Colorado | 41.80 | 37 | Florida | 26.19 |
| 12 | Rhode Island | 39.92 | 38 | Kansas | 25.59 |
| 13 | Mississippi | 38.54 | 39 | South Carolina | 25.24 |
| 14 | West Virginia | 38.22 | 40 | N. Hampshire | 25.13 |
| 15 | Maine | 37.37 | 41 | Vermont | 24.92 |
| 16 | Texas | 36.85 | 42 | North Dakota | 24.49 |
| 17 | Arizona | 33.84 | 43 | North Carolina | 24.15 |
| 18 | Massachusetts | 33.74 | 44 | Illinois | 23.49 |
| 19 | Idaho | 32.74 | 45 | Iowa | 22.92 |
| 20 | Utah | 32.72 | 46 | Tennessee | 22.15 |
| 21 | South Dakota | 32.04 | 47 | Ohio | 20.64 |
| 22 | Georgia | 31.74 | 48 | Delaware | 19.51 |
| 23 | Washington | 31.57 | 49 | Indiana | 17.93 |
| 24 | Wyoming | 31.06 | 50 | Michigan | 13.79 |
| 25 | Arkansas | 30.86 | 51 | Minnesota | 13.31 |
| 26 | Oregon | 30.58 |