New data offers more concerning signs on Minnesota’s labor market
I’ve written recently about emerging problems in Minnesota’s labor market. Specifically, between June 2018 and June 2019, our state was above average for population growth, below average for employment growth, top for unemployment growth. The Bureau of Labor Statistics released its Metropolitan Area Employment and Unemployment Summary for July 2019 today, and the pictures remains concerning.
The state of the state
Looking at the states, Minnesota was the worst performing state in the union between July 2018 and July 2019. While the number of unemployed people fell nationally by 2.3% (154,921) and the unemployment rate fell from 4.1% to 4.0%, in Minnesota not only did the number of unemployed people increase, but this increase (21,104) was the highest in the country at 25.4%. Minnesota’s unemployment rate increased over the period by 0.6 percentage points, from 2.7% to 3.3%, the second highest increase in the United States. Figure 1 shows the change in the number of unemployed in the states and District of Columbia, and Figure 2 shows the change in the unemployment rate.
Figure 1: Change in the number of unemployed people, July 2018 to July 2019
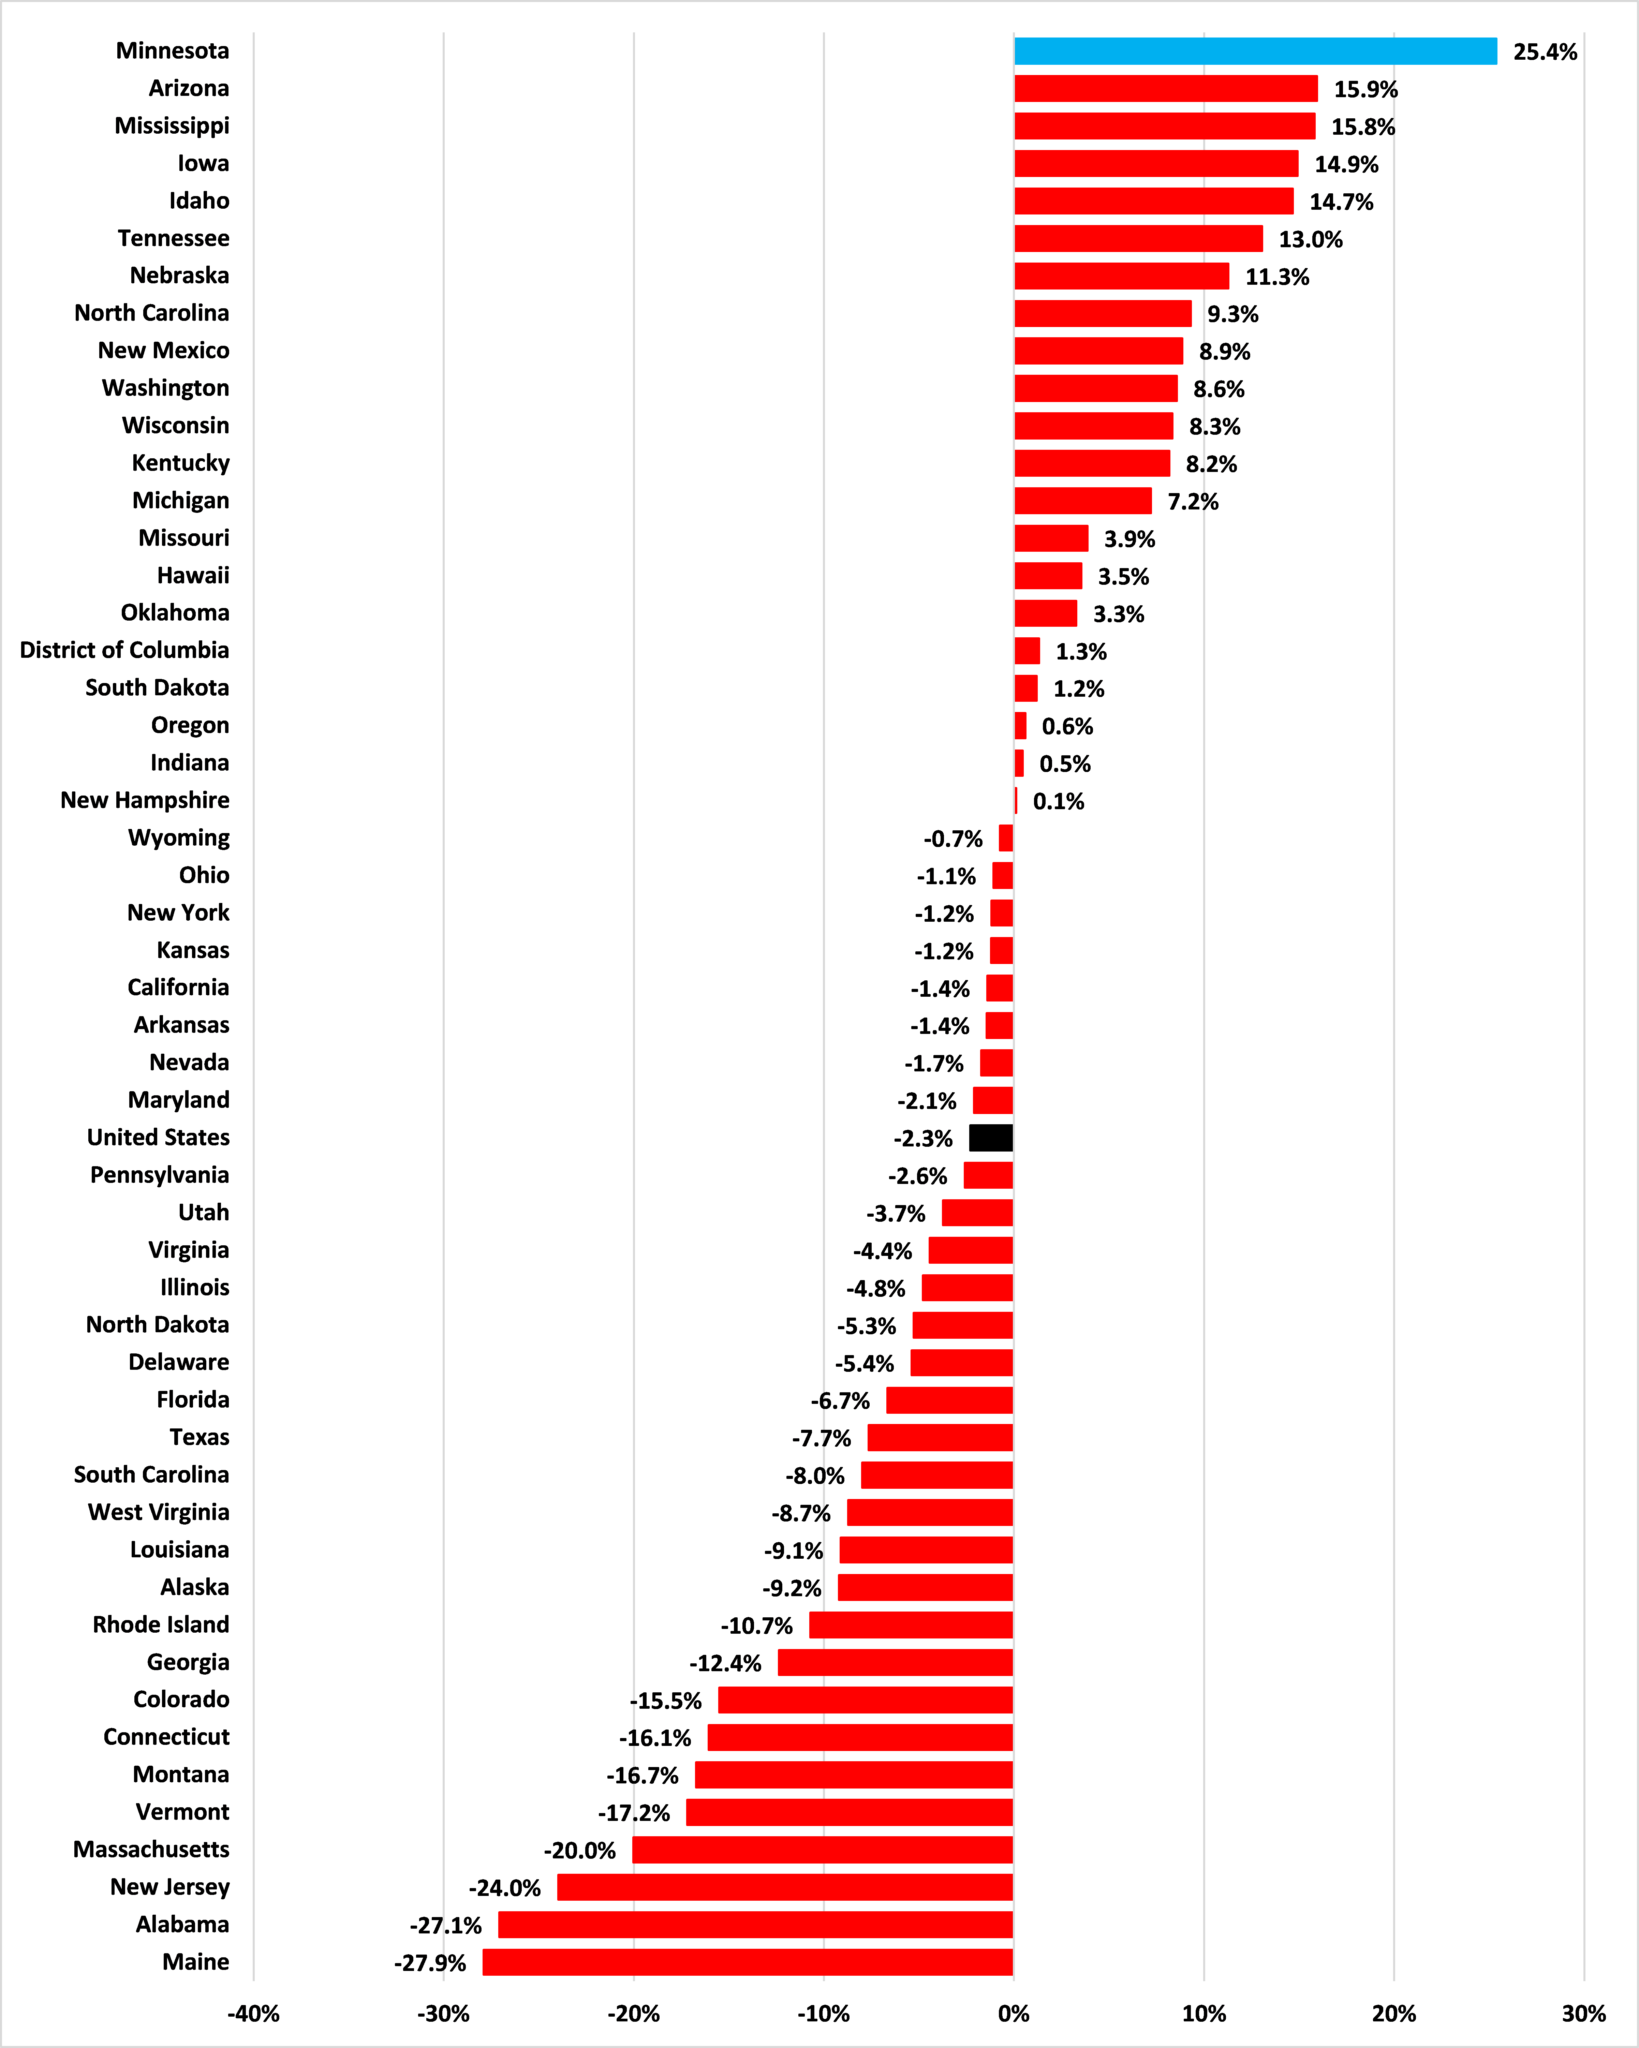
Source: Bureau of Labor Statistics
Figure 2: Percentage point change in the unemployment rate, July 2018 to July 2019
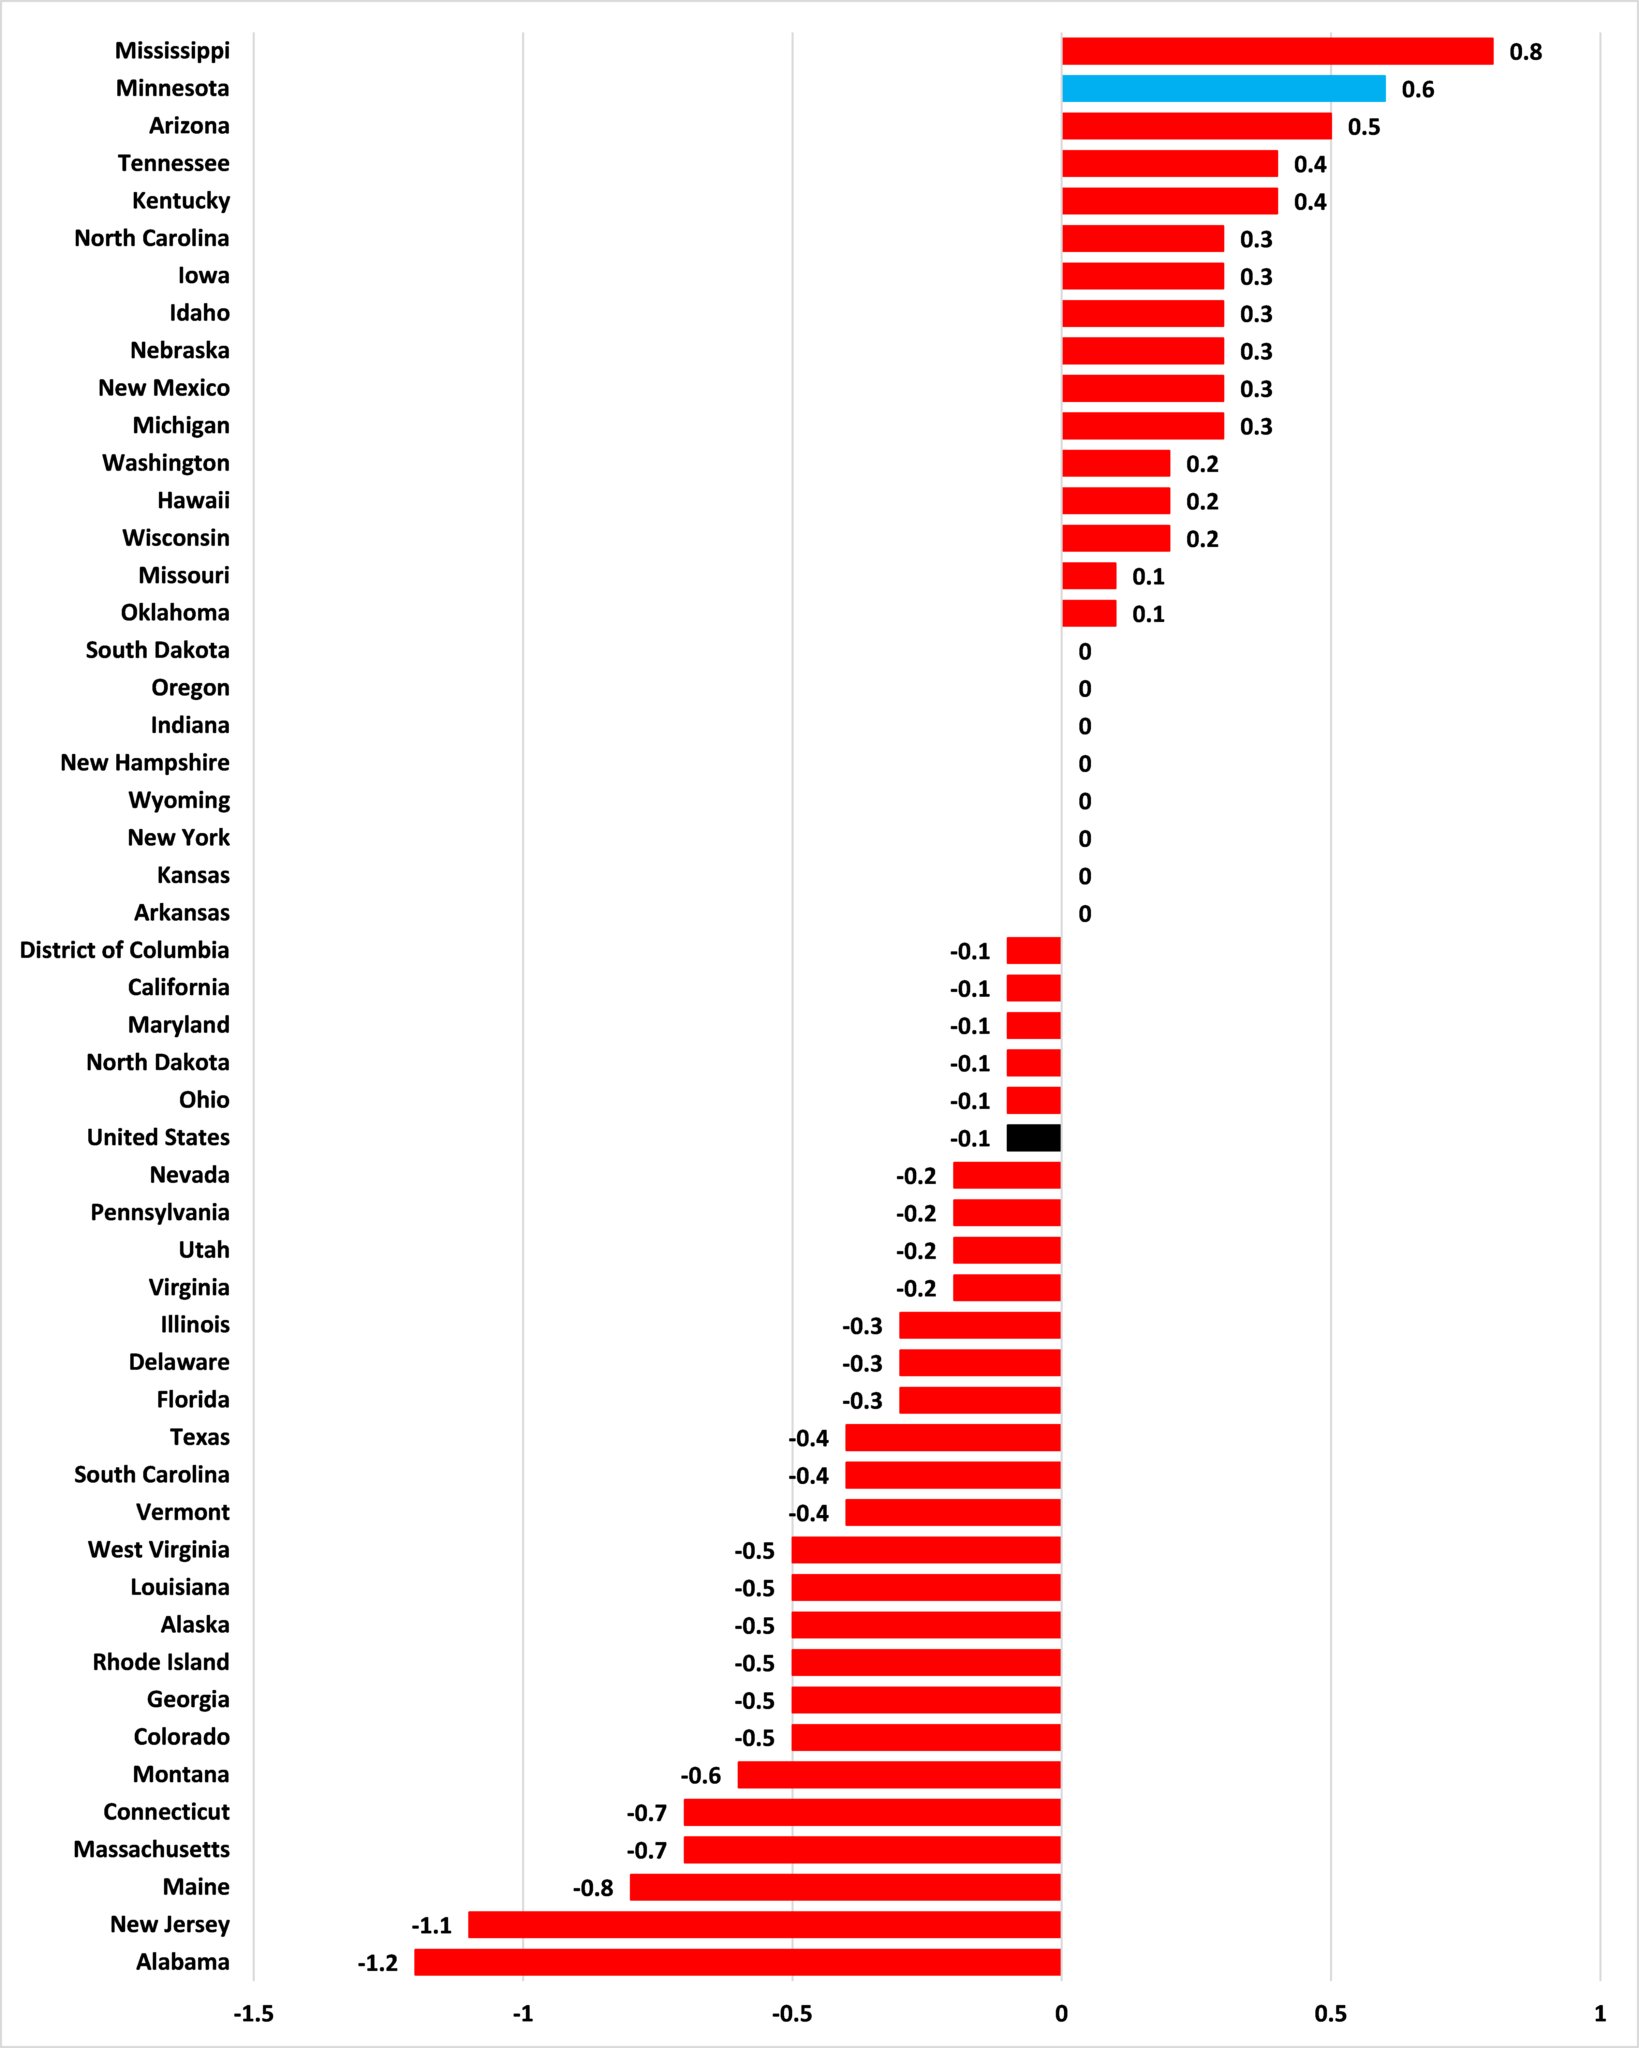
Source: Bureau of Labor Statistics
These numbers have had an impact on Minnesota’s relative performance. In July 2018, our state’s unemployment rate was the 8th lowest in the United States. In July 2019, that was down to 16th.
Minnesota’s cities
What is the story with Minnesota’s cities?
From July 2018 to July 2019, each of Minnesota’s Metropolitan Statistical Area’s (MSAs) has seen its number of unemployed residents rise. These increases ranged from 18.9% in Duluth to 31.7% in Rochester, as Figure 3 shows. By contrast, for the portion of the United States in the 391 MSAs, the number of unemployed fell over the period by 3.2%.
Figure 3: Change in the number of unemployed people, July 2018 to July 2019
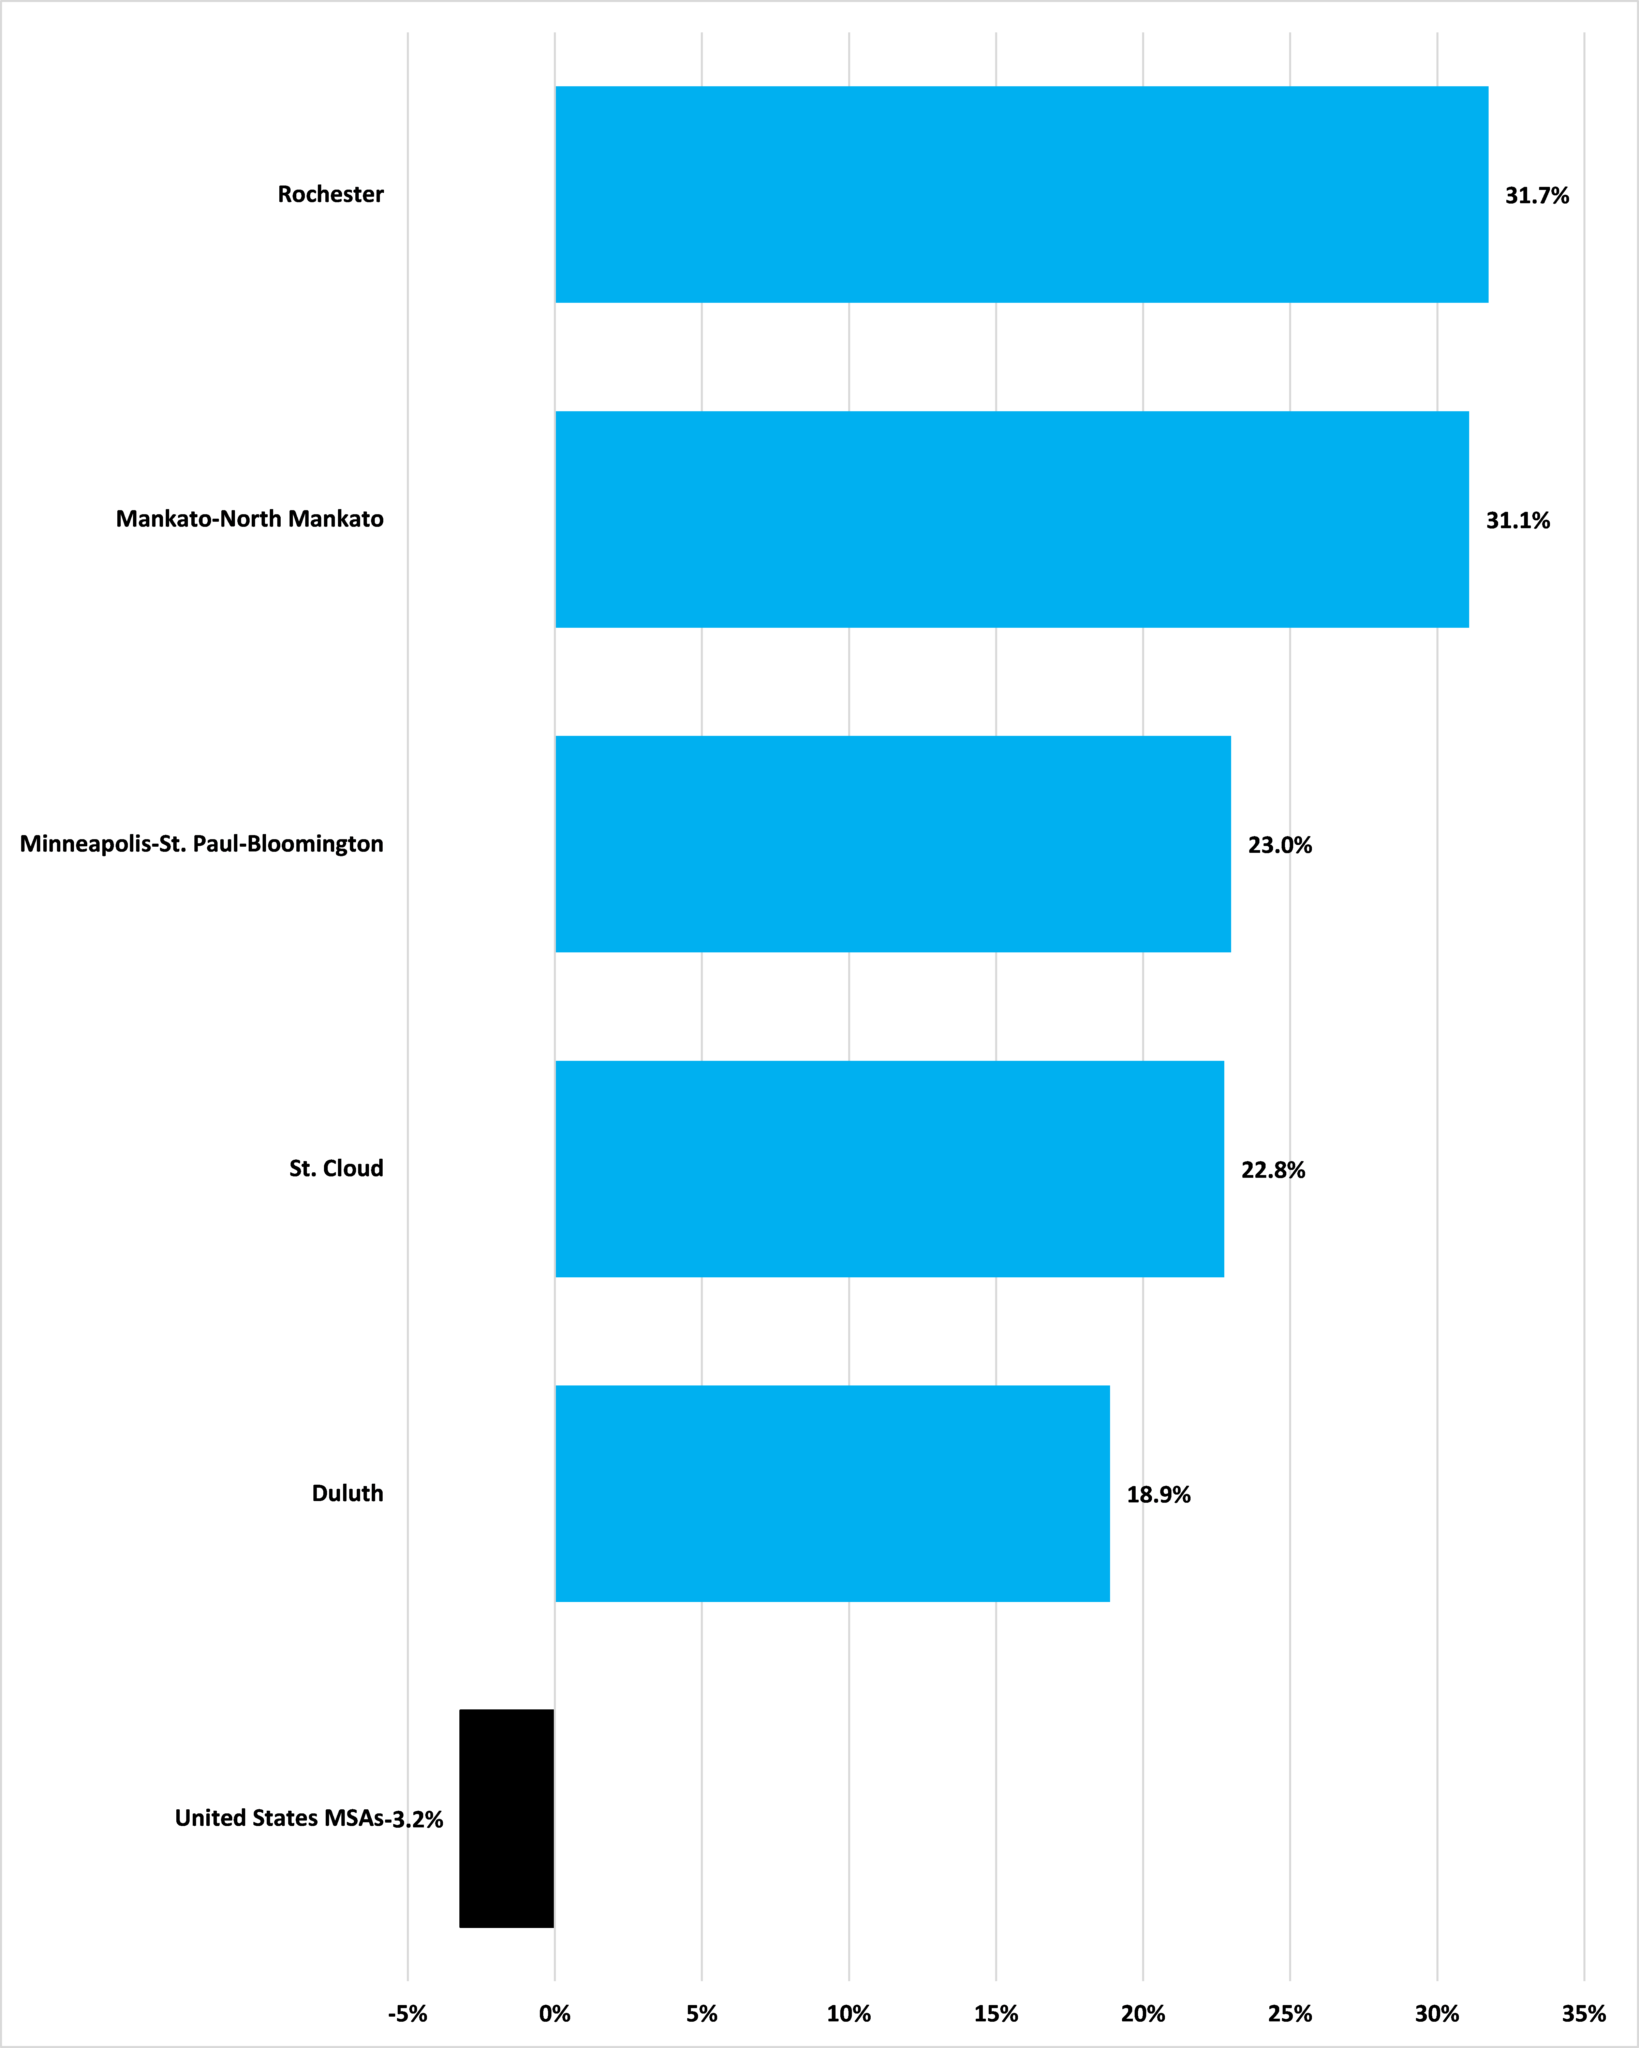
Source: Bureau of Labor Statistics
Likewise for unemployment rates. From July 2018 to July 2019, the unemployment rate in the portion of the United States in MSAs fell by 0.2 percentage points, from 4.1% to 3.9%. By contrast, in all five Minnesota MSAs, the unemployment rate was higher in July 2019 than it was in July 2018, as Figure 4 shows.
Figure 4: Percentage point change in the unemployment rate, July 2018 to July 2019
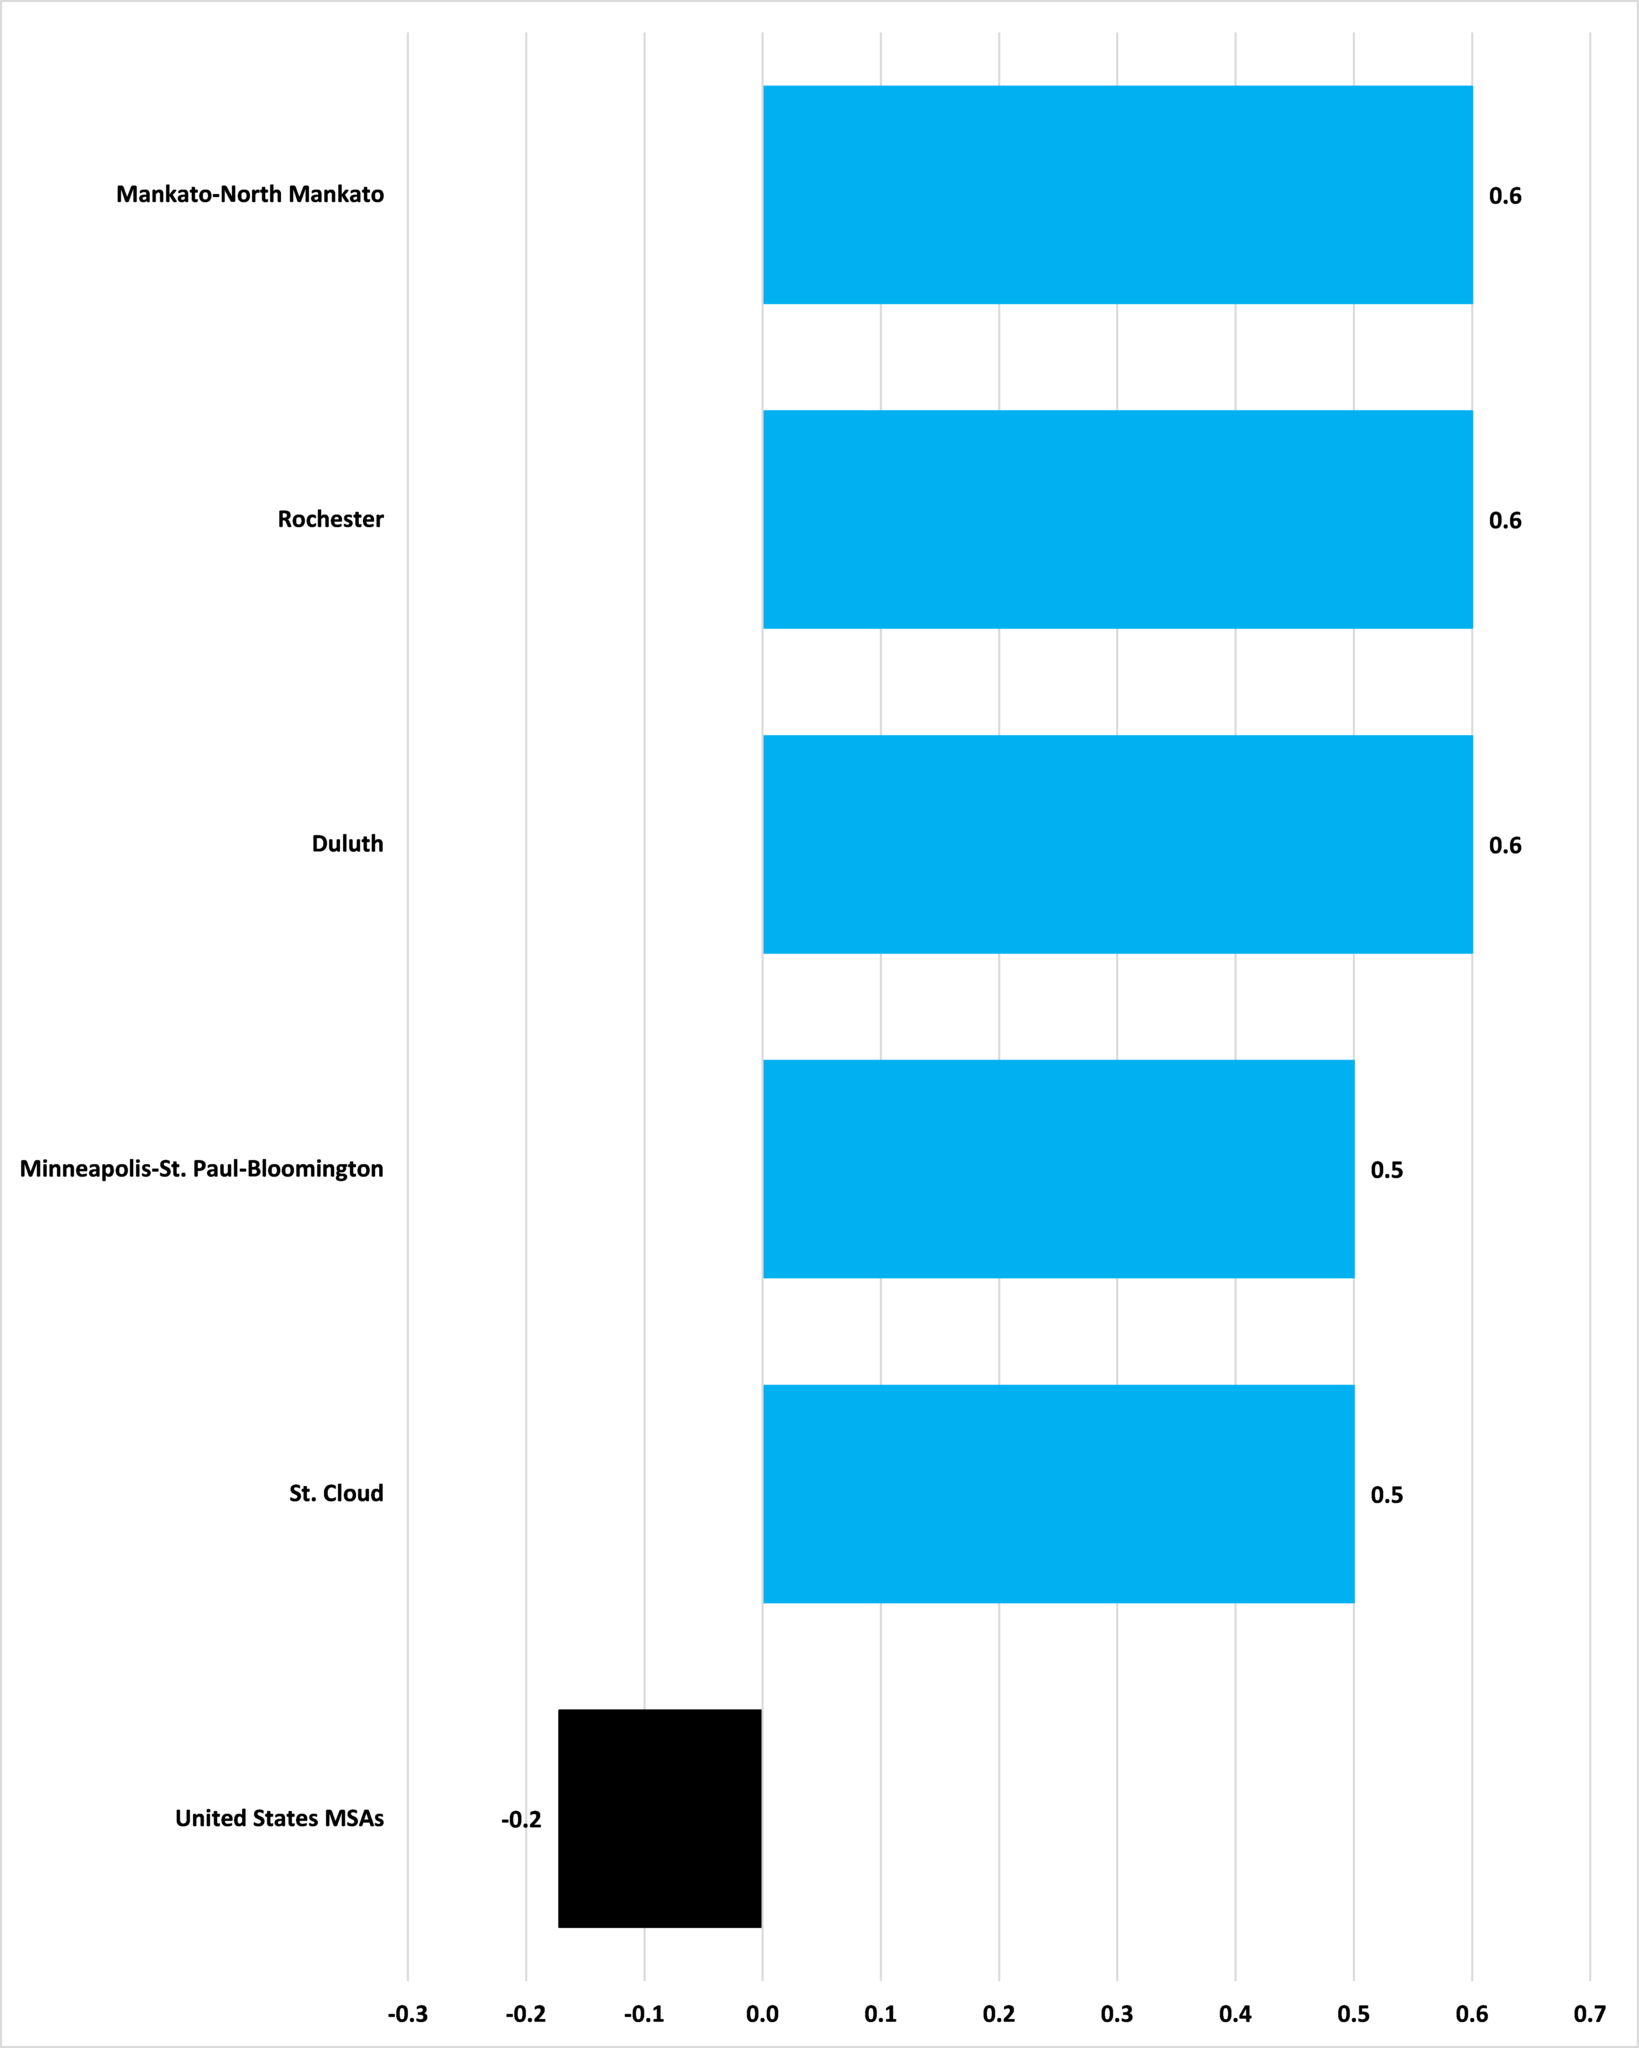
Source: Bureau of Labor Statistics
The US labor market is in good shape, especially considering the length of this economic expansion and some of the warning signs that have been flashing lately. But Minnesota is not part of that. Over the last year, our labor market has deteriorated. If – when – a downturn does come, we will not be as well placed to face it as we could be.
John Phelan is an economist at the Center of the American Experiment.