Who is hit hardest by COVID-19?
Minnesota’s headline Covid-19 numbers
According to the Minnesota Department of Health’s Weekly Covid-19 Report running to July 30th, 53,692 Minnesotans have tested positive for Covid-19, 5,112 have been hospitalized, 1,490 of these have needed intensive care (ICU) treatment, and 1,594 have died.
But 79.4% of these deaths have come in care homes. Not only is this one of the highest shares in the United States, it suggests that Covid-19 is not equally dangerous to everybody. For example, 3,718 of Minnesota’s Covid-19 cases have come in ‘Long-term care facility/Assisted living (LTCF)’ and 1,266 of its deaths have come from ‘Congregate care’. This means that 34.1% of care home cases have resulted in death. Outside of care homes, Minnesota has had 49,974 cases of Covid-19 and 328 deaths. In other words, just 0.7% of Covid-19 cases outside care homes have resulted in death in Minnesota. A care home case has a 27.2% chance of requiring hospitalization and 25.6% change of needing ICU treatment: outside of care homes, those numbers fall to 7.5% and 2.2% respectively.
Whether you are a care home resident or not seems to make a big difference to how likely you are to die from Covid-19. What other factors might indicate how concerned we should be?
How sex affects Covid-19
One factor that doesn’t appear to make much difference in terms of how Covid-19 affects you is your sex.
As Figure 1 shows, the breakdown of Minnesota’s Covid-19 cases by sex matches the breakdown of its population by sex fairly closely. As Figure 2 shows, there is also little apparent impact of sex on the acuteness of Covid-19. Men are slightly more likely to need ICU treatment, but the likelihood of a case resulting in death – about 3 in 100 – is exactly the same.
Figure 1: Percentage of population and percentage of Covid-19 cases by sex
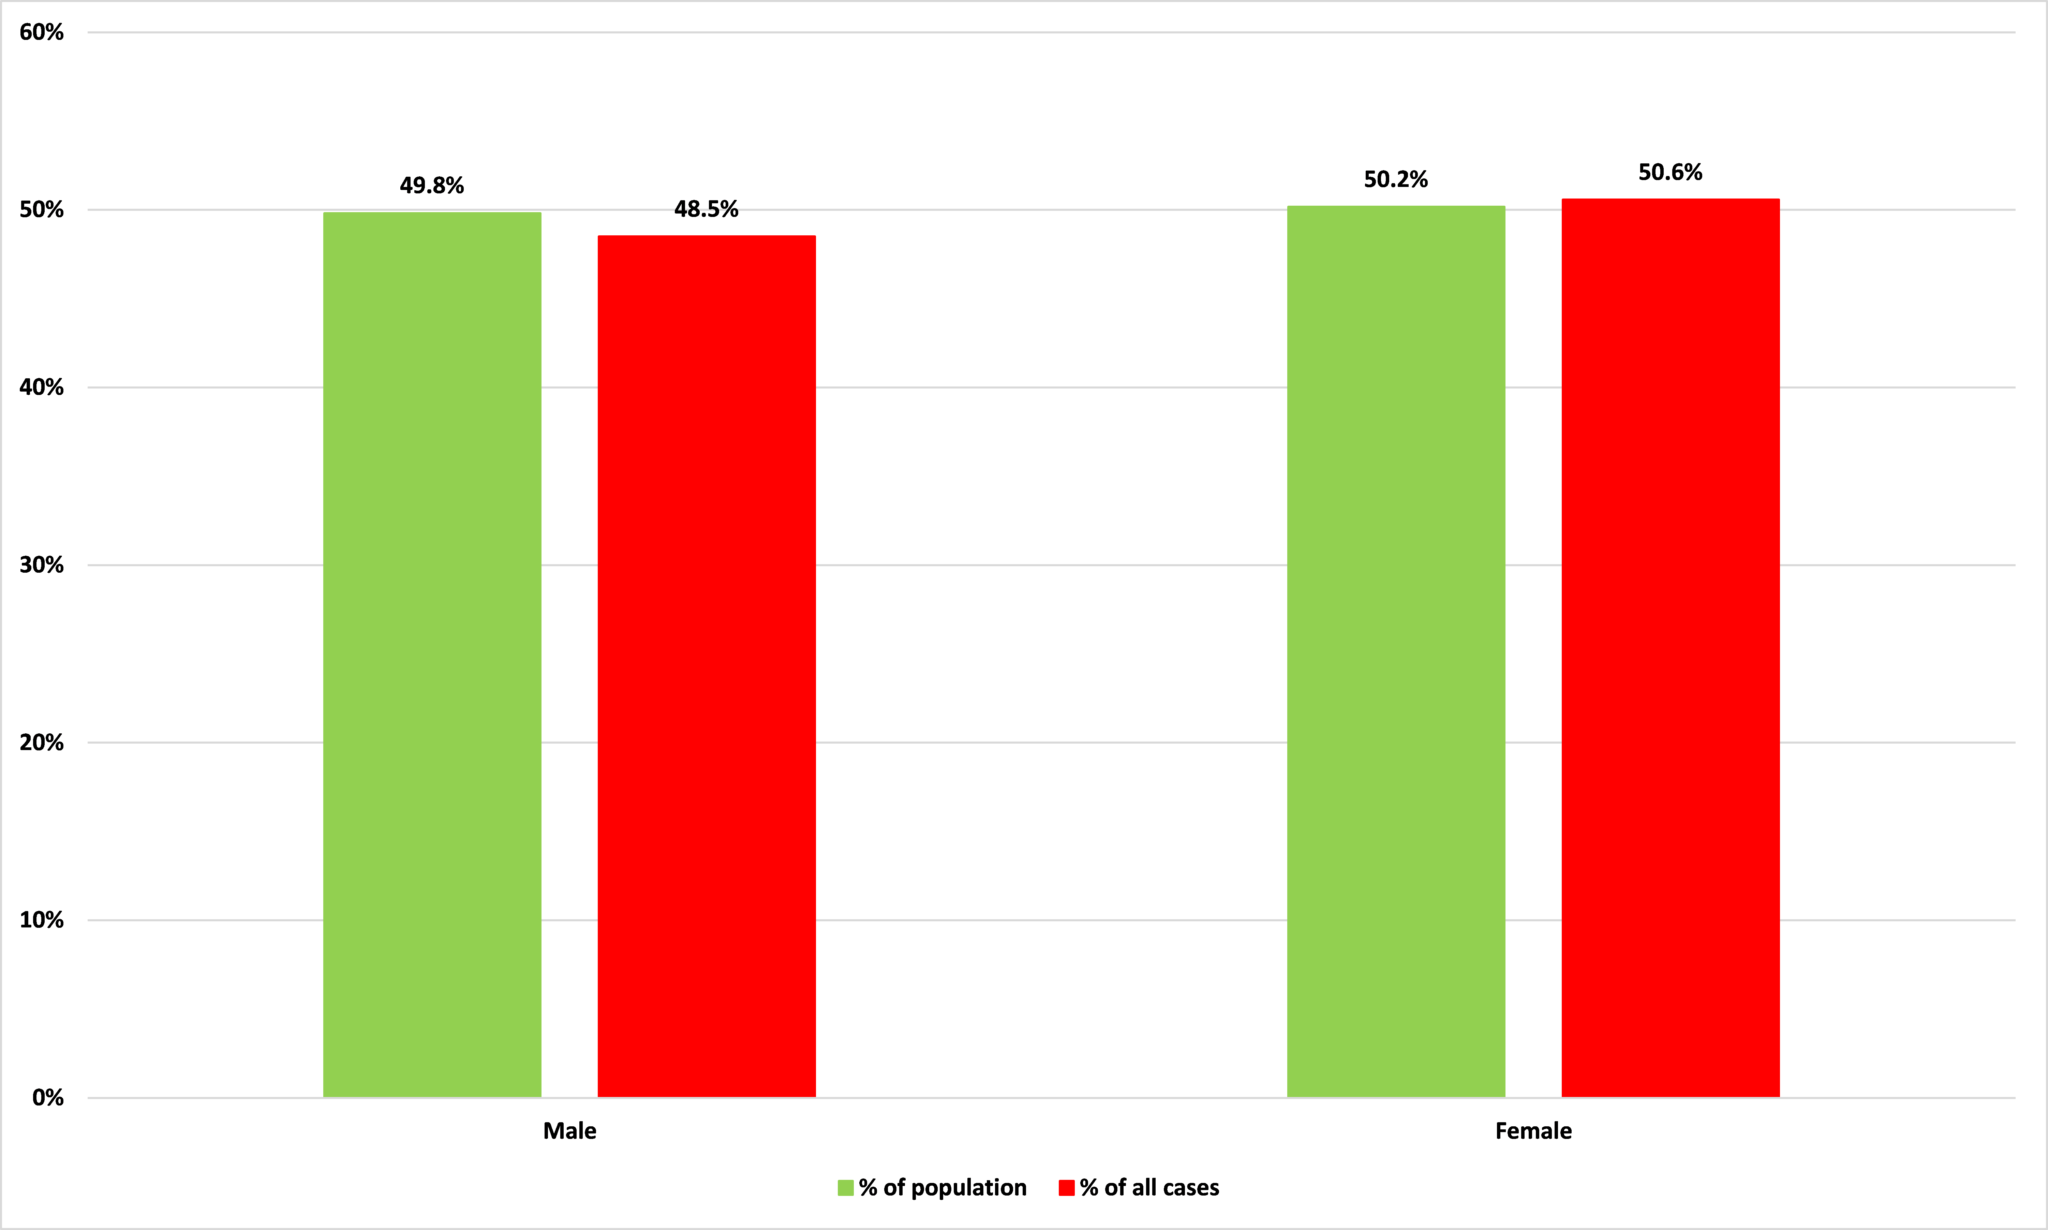
Source: Minnesota Department of Health and Census Bureau
Figure 2: Figure 2: Percentage of cases by sex resulting in hospitalization, ICU care, or death
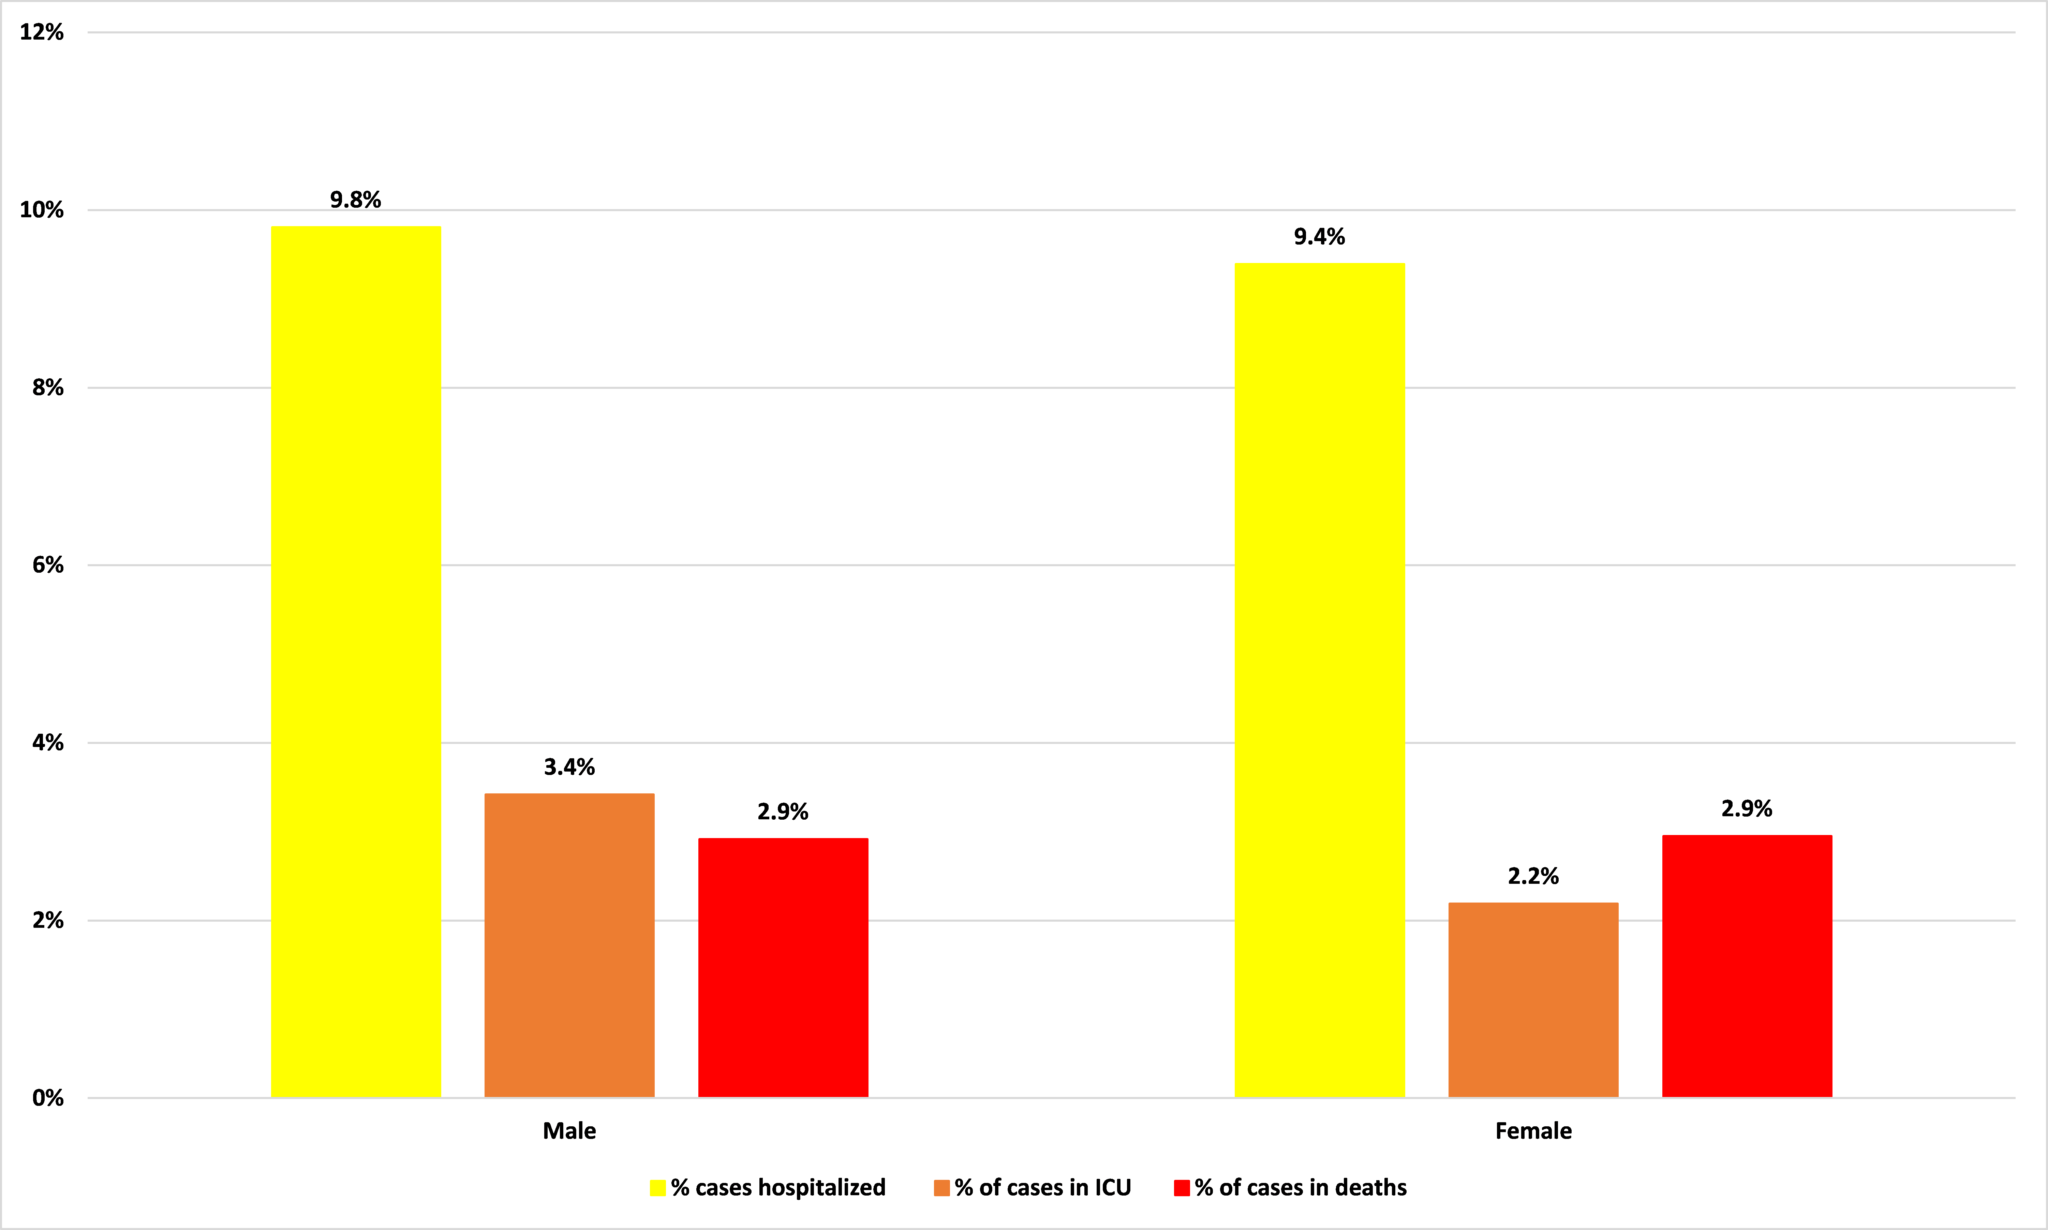
Source: Minnesota Department of Health
How age affects Covid-19
One of the strongest indicators of how a Covid-19 infection will impact you is your age.
Figure 3 shows the percentage of Minnesotans in each age group according to the Census Bureau, and the percentage of Covid-19 cases in each age group. Where the bar for percentage of population is lower than the bar for percentage of cases, that category is disproportionately likely to be infected by Covid-19.
Those aged between 20 and 49 and those over 80 are particularly at risk of catching Covid-19. Together, they account for 42.6% of Minnesota’s population but 61.9% of its Covid-19 cases.
Figure 3: Percentage of population and percentage of Covid-19 cases by age group
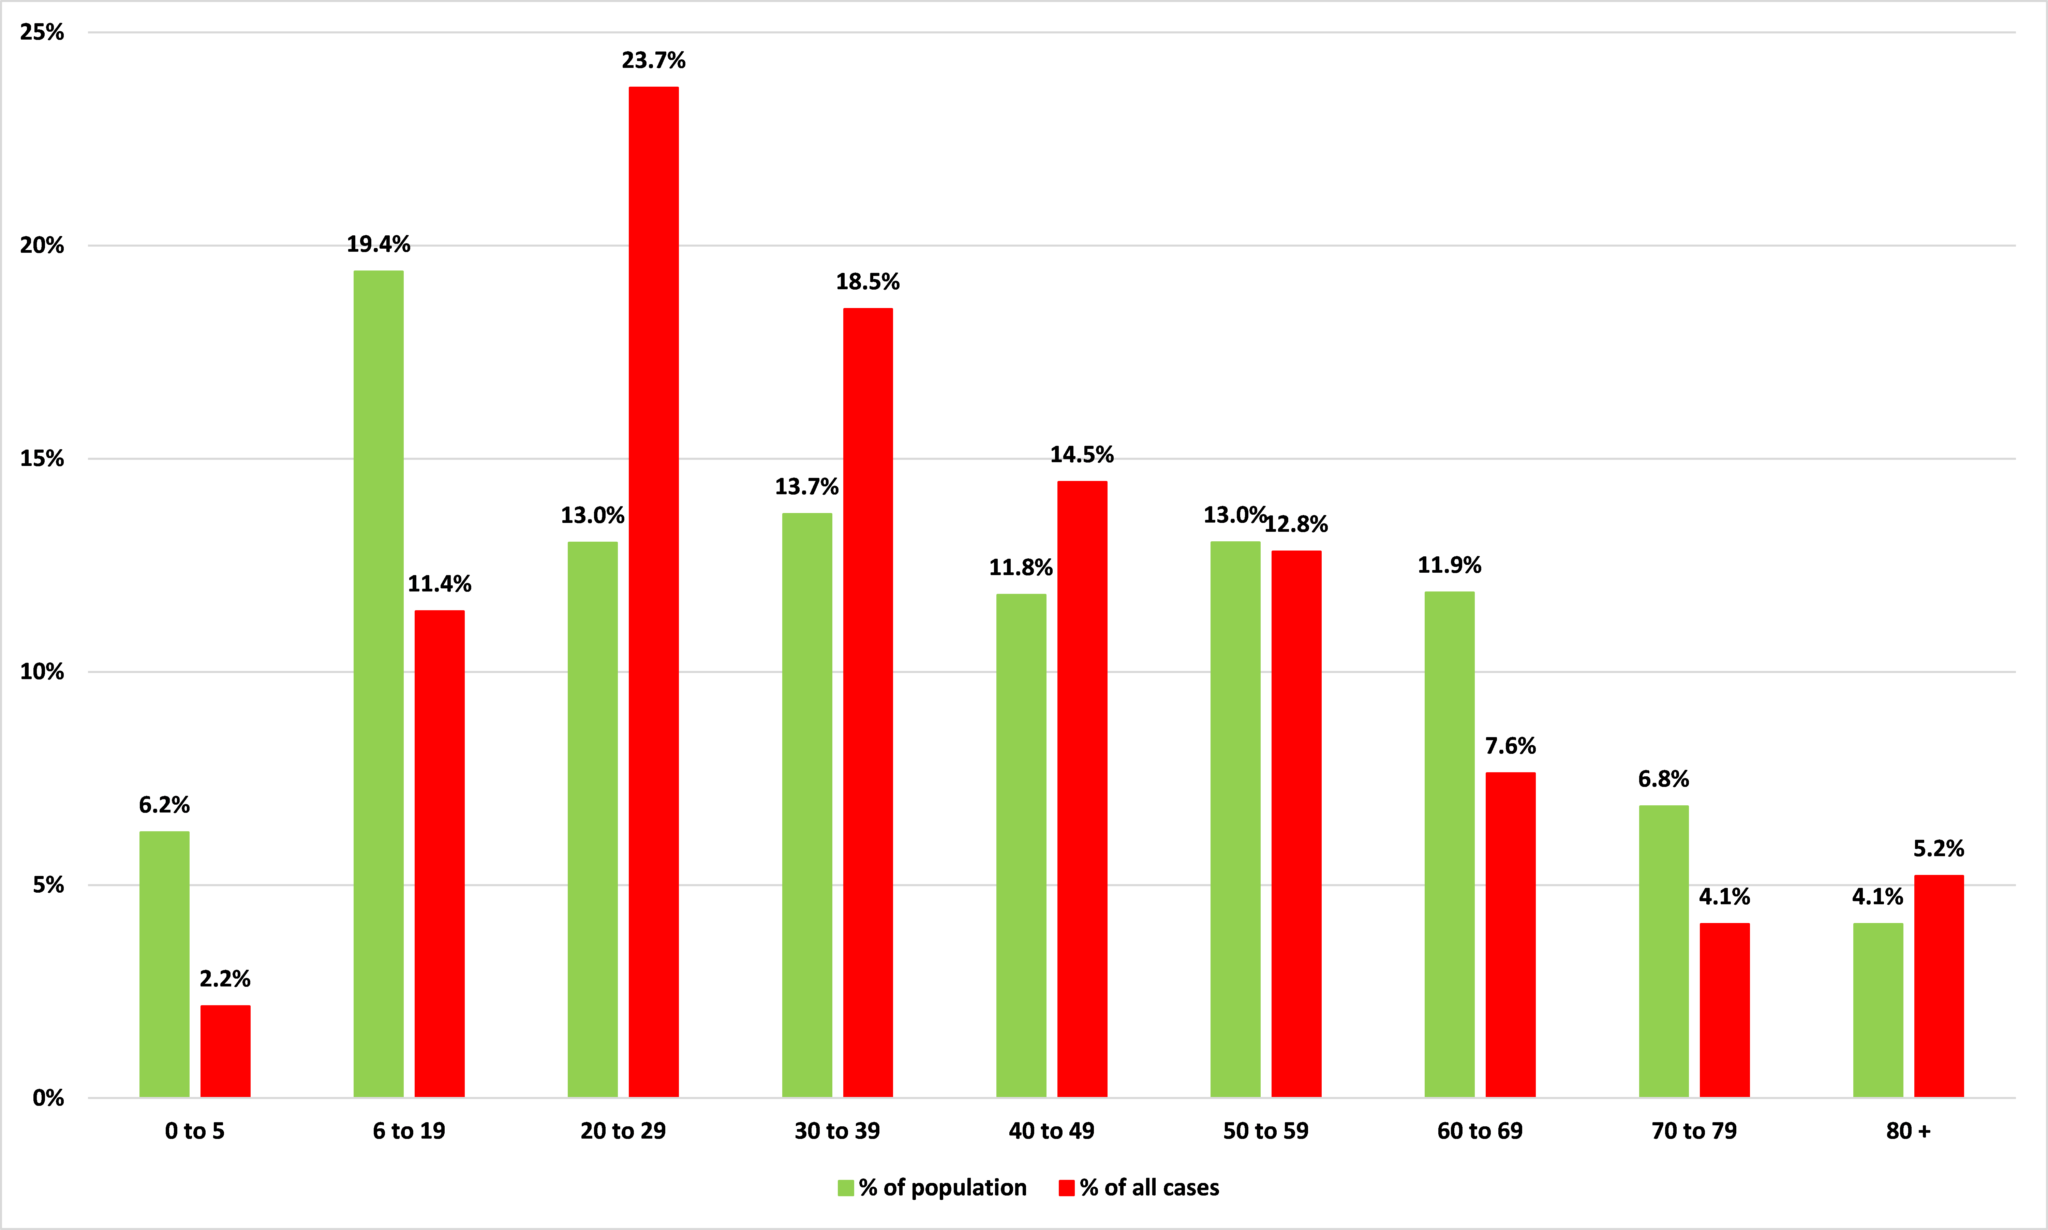
Source: Minnesota Department of Health and Census Bureau
There is better news for these younger age groups, however, when we look at how likely these folks are to be acutely affected by Covid-19, ie, to be hospitalized, need ICU treatment, or die. Figure 4 shows the percentage of cases in each age category which result in either hospitalization, ICU care, or death.
If you are aged 30 to 39, for example, and you are infected with Covid-19, you have a 5.3% chance of being hospitalized, a 1.0% chance of needing ICU treatment, and a 0.1% chance of dying. By contrast, among the 80+ age group, those who catch Covid-19 in Minnesota have a 29.8% chance – nearly 1 in 3 – of dying from it.
Figure 4: Percentage of cases per age group resulting in hospitalization, ICU care, or death
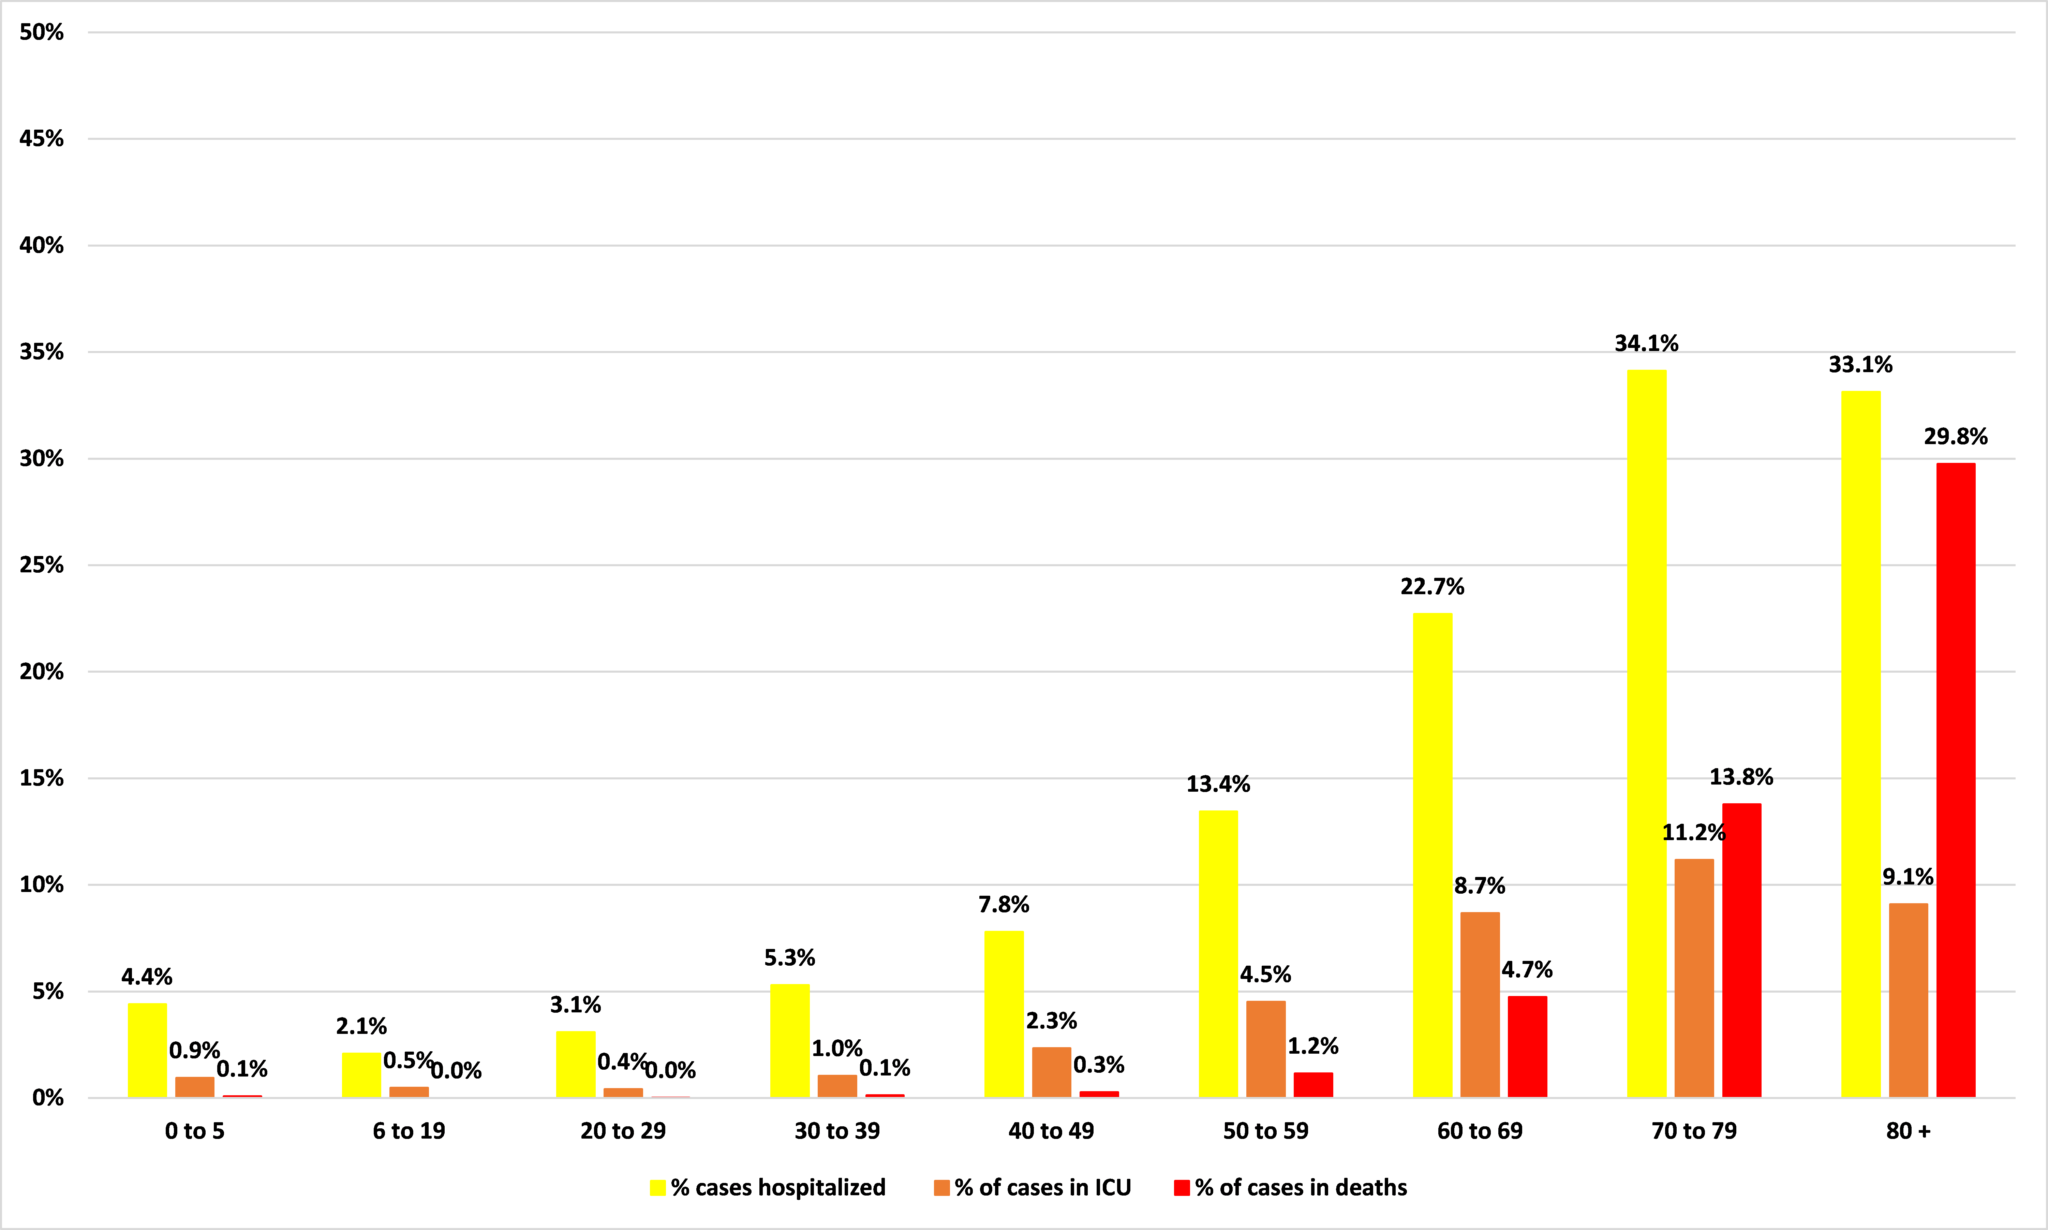
Source: Minnesota Department of Health
How race affects Covid-19
Another demographic characteristic which seems to have an impact on Covid-19 outcomes in Minnesota is race.
As Figure 5 shows, while whites make up 83.8% of Minnesota’s population, they account for just 45.4% of its Covid-19 cases. Black Minnesotans are the other group for which there is a marked imbalance between the share of population and the share of cases: while they make up 7.0% of the state’s population, black Minnesotans account for one fifth of its Covid-19 cases.
Figure 5: Percentage of population and percentage of Covid-19 cases by race
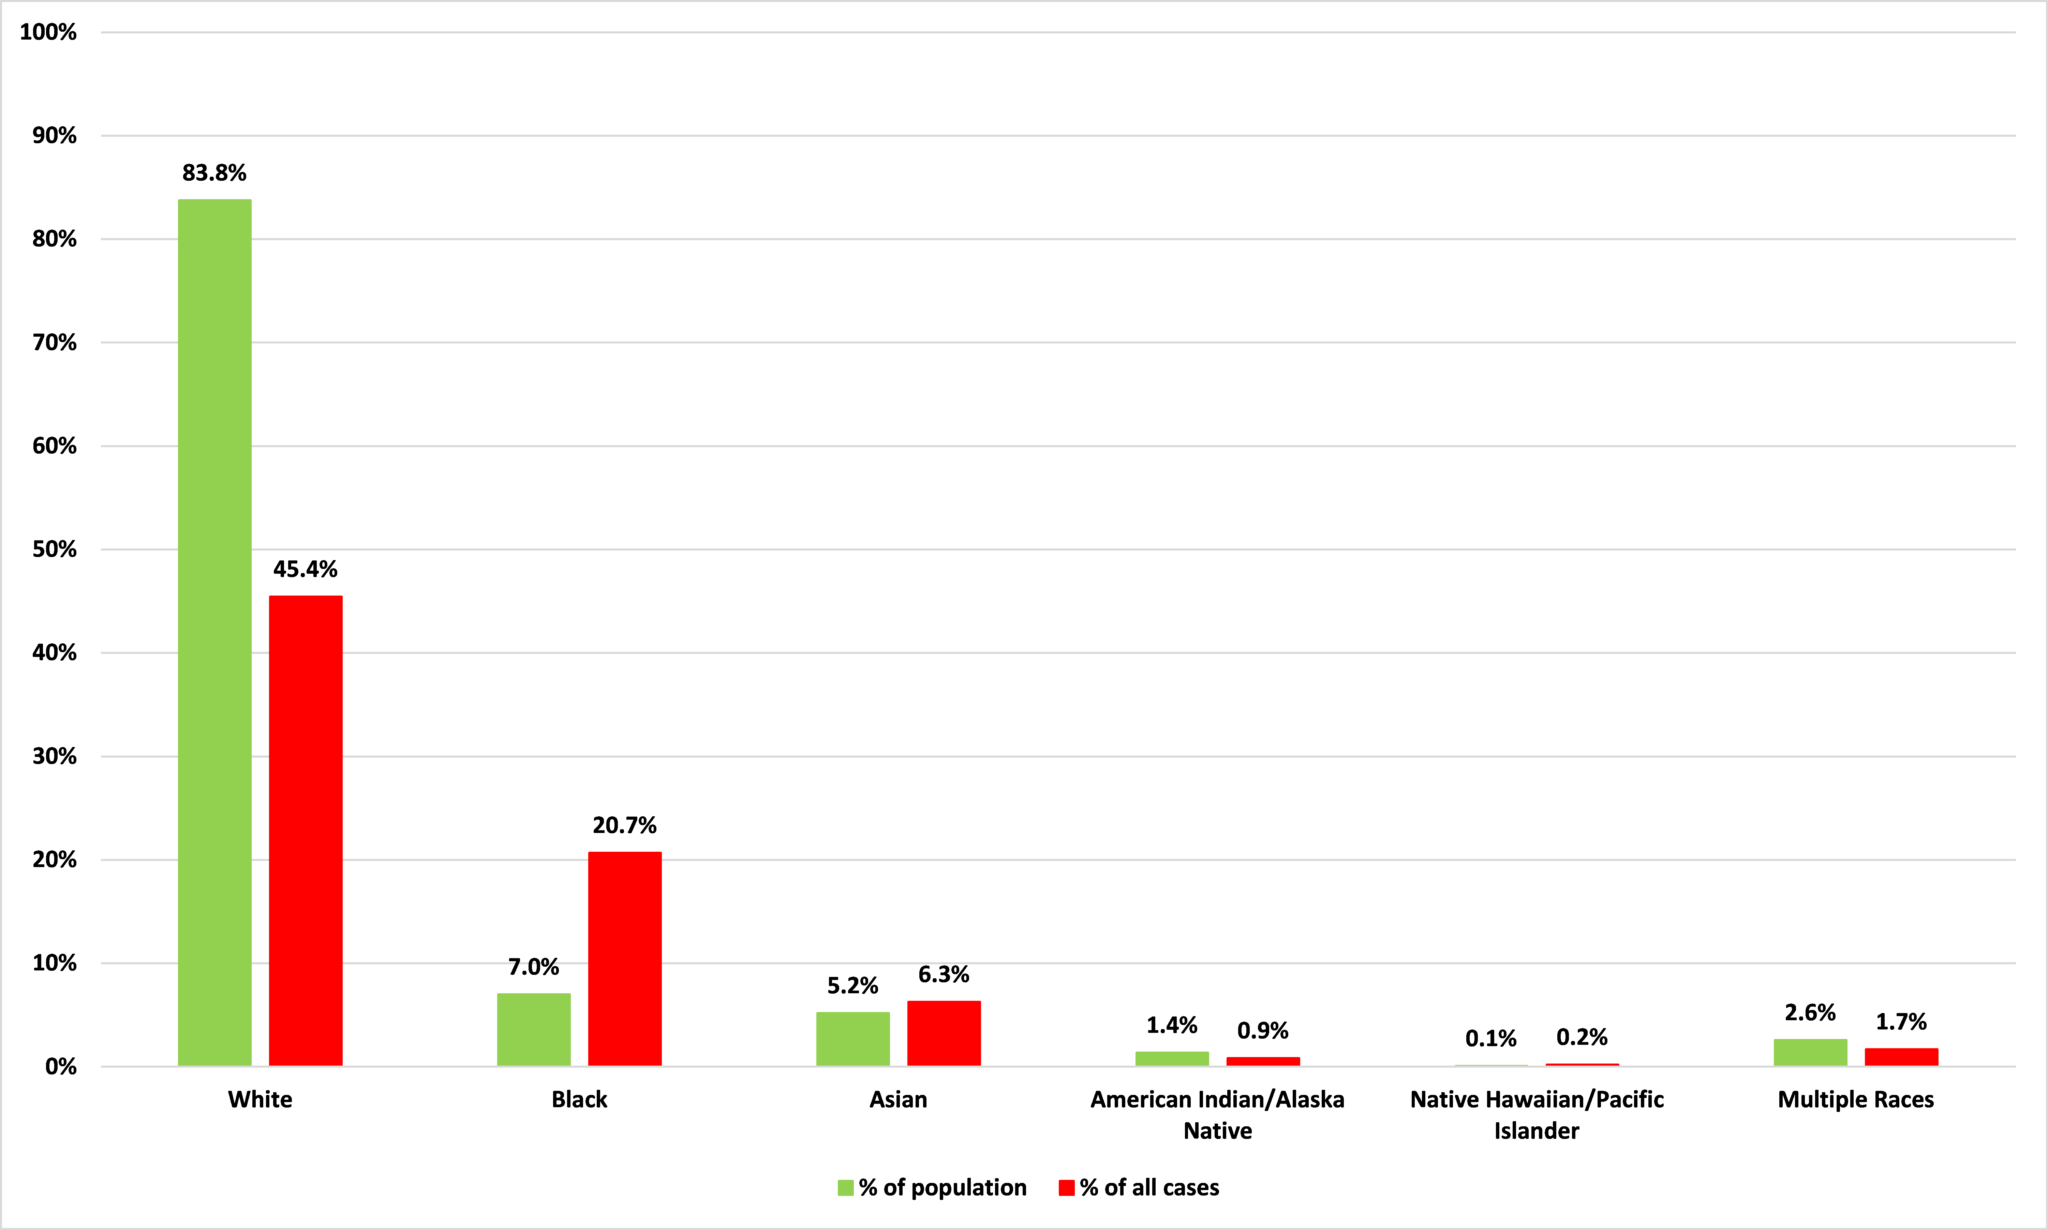
Source: Minnesota Department of Health and Census Bureau
But there is a striking disconnect between these figures for likelihood of infection/cases and those on how acutely a case of Covid-19 will affect people of different racial groups. As Figure 6 shows, there isn’t too much variation across racial groups in terms of whether a diagnosed Covid-19 case results in hospitalization, with Asians at a slightly higher risk. The same is true for ICU treatment, there is little variation with Asians slightly more likely to need it. For deaths, there is, again, little variation except for whites: 5 out of 100 white Covid-19 patients die.
What leaps out is the figures for American Indian/Alaska Natives. Among Native Americans, more than a quarter of all Covid-19 cases require hospitalization and more than one in ten need ICU care. Nearly 7 out of 100 Native American Covid-19 patients die. So, while Figure 5 shows that Native Americans are a little less likely to get Covid-19 than their share of the population would suggest, when they do it is particularly acute. For black Minnesotans, it is the other way around.
Figure 6: Percentage of cases per age group resulting in hospitalization, ICU care, or death
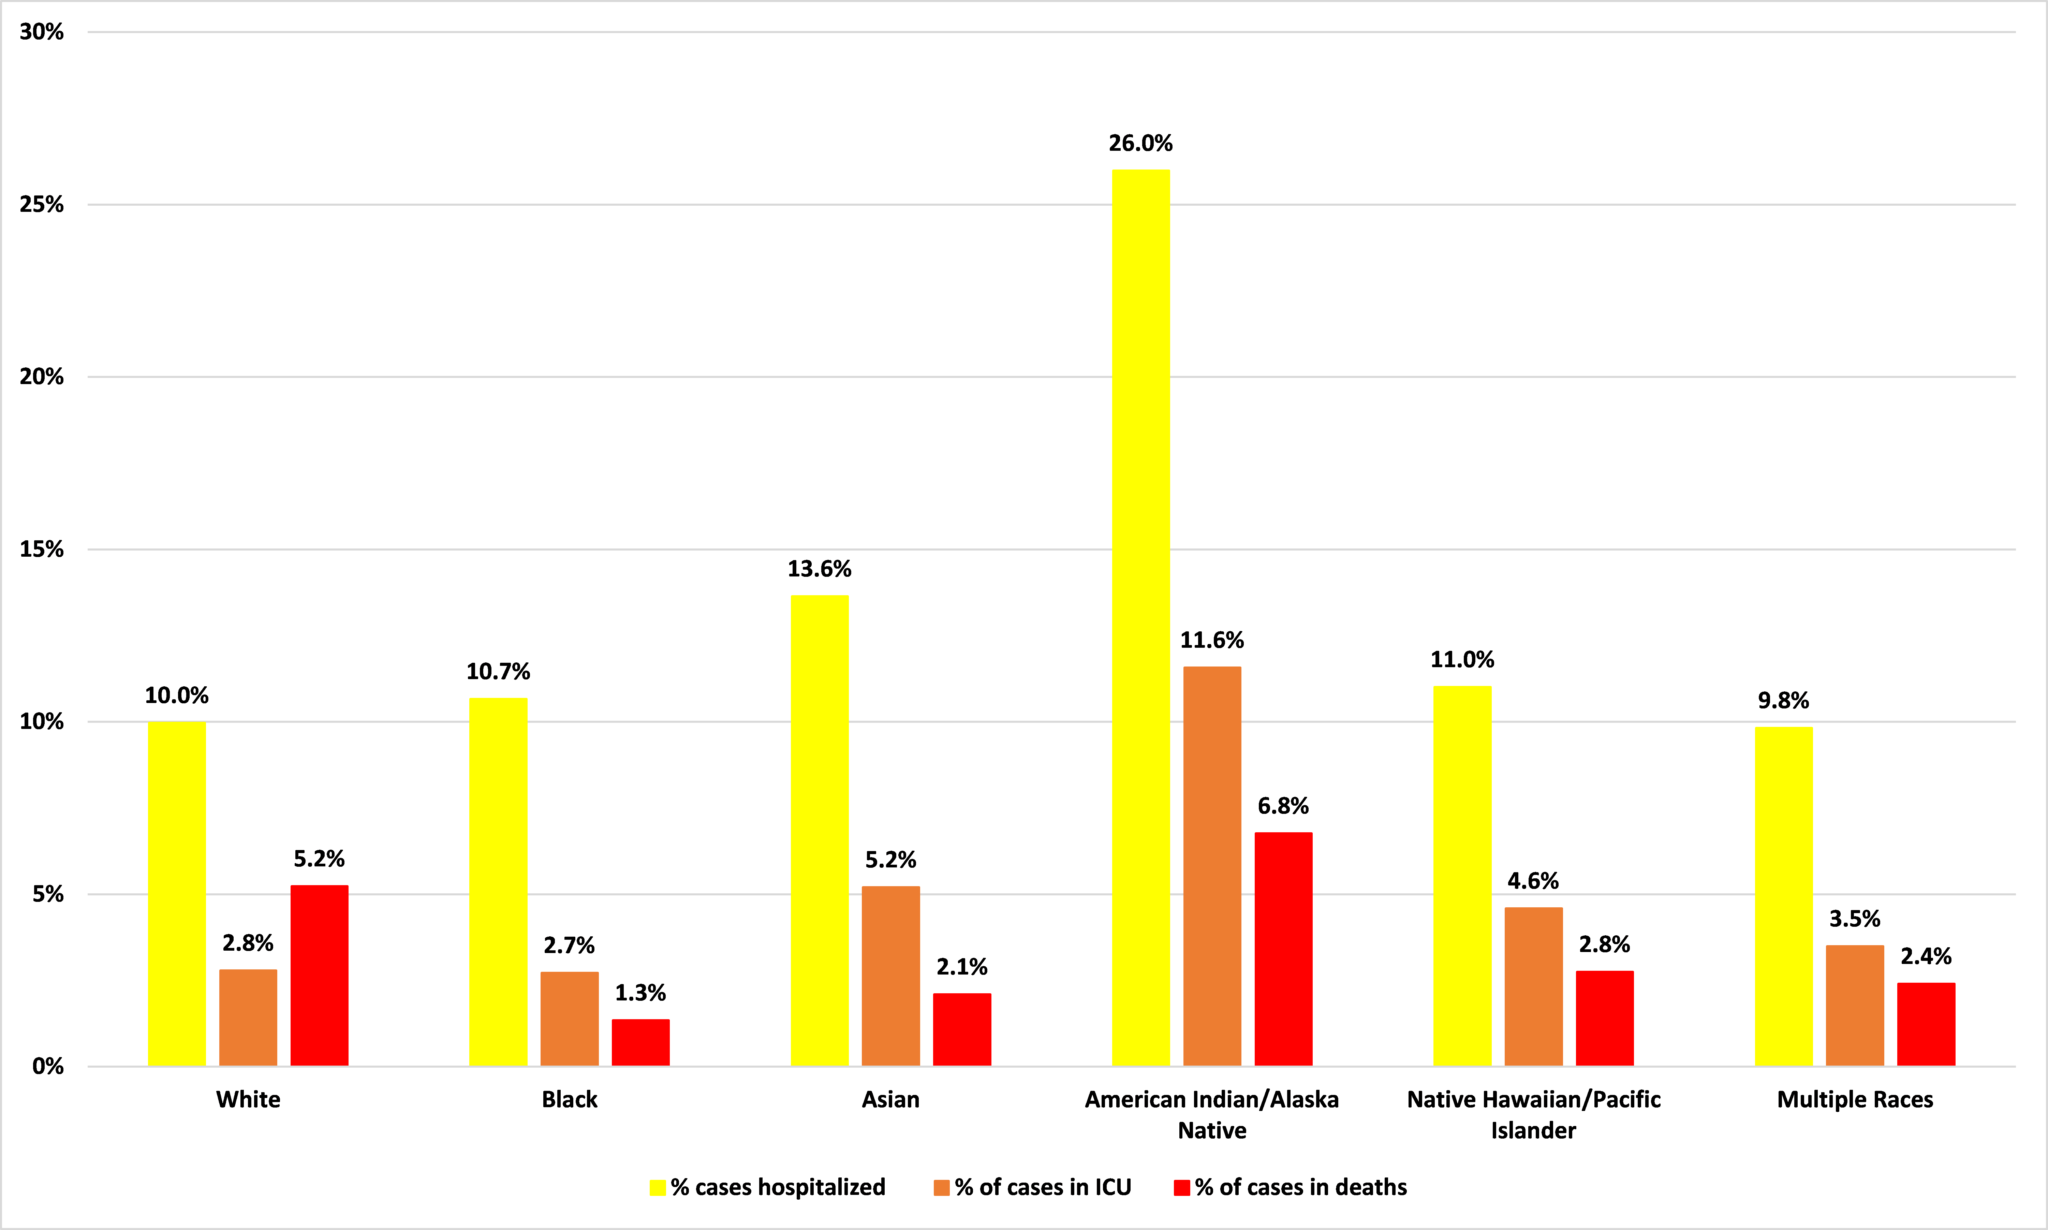
Source: Minnesota Department of Health
Putting it all together
Remember, these are just the cases we know about. As I wrote recently, new research from the Centers for Disease Control and Prevention (CDC) suggests 10 times more Minnesotans might have been infected with Covid-19 than we know of (back in late April the Star Tribune reported that state officials believed that there are were many as 100 unconfirmed infections for every one lab-confirmed case in Minnesota). If the CDC is correct, the true number of infections could be around 537,000: 9.5% of the state’s population, most of them without ever knowing they had been infected.
If this 537,000 number is correct, that means that 1.0% of all infections end up in hospital, 0.3% of all infections go to ICU, and 0.3% end in death (this is the Infection Fatality Rate).
These undetected cases are likely to be among the younger population groups because they are more likely to be asymptomatic. If this is correct, then the numbers in Figure 2 would fall for those younger age categories.
What we can say, broadly speaking, is that care home residents, 20-49 year olds and African Americans are more likely that you would expect based on their population shares to contract Covid-19. But, for both groups, the chances of this resulting in an acute infection are lower than you would expect. Its is care home residents, people aged 70 and over, Native Americans and, to a lesser extent, Asians who are at a higher risk of an infection becoming acute and resulting in hospitalization, ICU care, or death.
Of course, there are exceptions. There are deaths among 20 to 49 year olds and among African Americans. But odds are calculated on an ‘on average’ basis. They don’t say that something will or won’t happen only that something is more or less likely to happen based on what we know. People sometimes argue that a policy is worth pursuing if it saves one life. This is a poor basis for public policy because we can imagine a circumstance in which any intervention saves one life: when we plan for worst case scenarios, we are limited only by the extent of our imaginations. We have to ask, not only what might happen, but how likely is it to happen. This is not just good advice in policy, it is a handy hint in life in general.