Minnesota’s ICU capacity is down 34% from November
On Monday, WCCO reported:
In hospitals as of Sunday, there are nearly 400 COVID-19 patients in ICU beds, with a total of 1,840 people with the virus needing hospitalization.
According to Minnesota’s COVID-19 Response Capacity dashboard, there are less than 100 open ICU beds available across Minnesota. There are 25 beds available in the Twin Cities, meaning metro ICUs are 96% full.
This pressure on healthcare capacity is the rationale behind Gov. Walz’ latest set of business closures and restrictions on the general public.
ICU capacity is down 34% from November
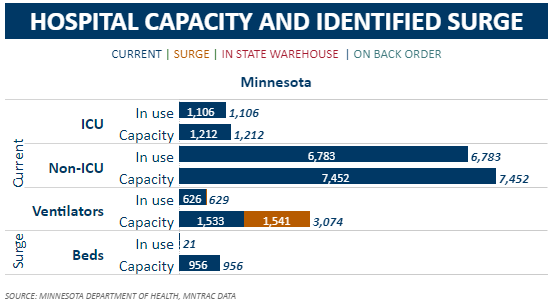
Indeed, as the Department of Health numbers in Figure 1 show, as of today, 1,106 – 91% – of Minnesota’s 1,212 ICU beds are occupied. For non ICU beds, this share is also 91%, with 6,783 out of 7,452 beds occupied.
Figure 1: December 4th
These numbers are a little curious for a couple of reasons.
First, the Department of Health appears to be no longer reporting the number of ICU beds available at 72 hours notice. Figure 2, for example, shows that on November 23rd there were 408 such beds in the state. On top of the capacity of 1,440, this gave a total ICU capacity of 1,848. If these beds still exist, why has the Department of Health stopped reporting on how many there are? If they no longer exists, then where on earth have they gone?
Figure 2: November 23rd
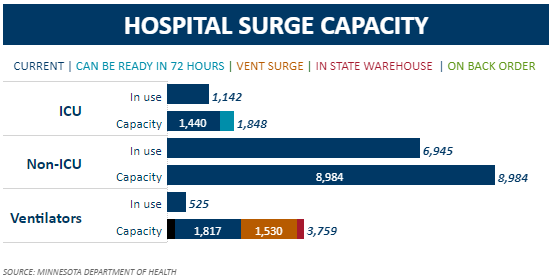
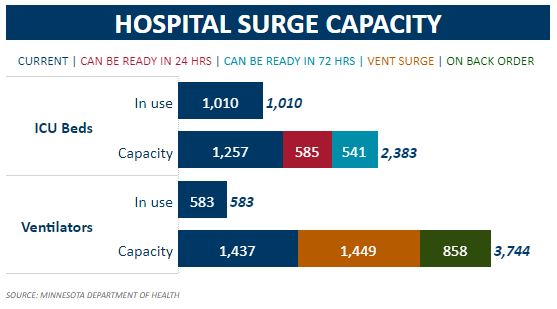
This brings us to the second curiosity, something I have noted before: the ongoing decline of ICU capacity in Minnesota in the midst of this pandemic. As noted above, we now have a reported ICU capacity of 1,212. As recently as November 23rd, as we see above, Minnesota had a reported ICU capacity of 1,440 with a total of 1,848 if we added beds available at 72 hours notice. And, if we look back to May 27th, as Figure 3 shows, the Department of Health was reporting an ICU capacity of 1,257 with a total of 2,383 if we added beds available at 72 hours notice. In short, our ICU capacity, including beds available at 72 hours notice, is down 34% from November 23rd and 49% from May 27th.
Figure 3: May 27th
Gov. Walz’ strategy has failed
This is, frankly, incredible, and represents a total failure of Gov. Walz’ strategy to fight Covid-19 in Minnesota.
When he issued a stay-at-home order on March 25, Gov. Walz said:
“The objective of everything we’re doing here is, it’s too late to flatten the curve as we talked about, the testing regimen was not in place soon enough for us to be able to do that, or expand it enough. So what our objective is now is to move the infection rate out, slow it down, and buy time so that the resources of the ICU and the hospitals and the things that we’re going to talk about today can be stood up to address that.”
On April 29th, when a peak ICU usage of 3,397 for June 29th was forecast, Gov. Walz said:
“I today can comfortably tell you that, when we hit our peak — and it’s still projected to be about a month away — if you need an ICU bed and you need a ventilator, you will get it in Minnesota.”
Well, here is the peak – much lower than forecast – and the whole system is, we are told, on the brink of collapse. Minnesotans have made many sacrifices to ensure that adequate ICU capacity is there when it is needed. They were told it was. It now appears that this was not the case.
The steep decline in non-Covid-19 hospitalizations is offsetting the surge in Covid-19 hospitalizations
There is some good news, however.
Figure 4 shows the surge in ICU hospitalizations diagnosed with Covid-19: in the seven days up to and including November 4th, the average number of people in ICU in Minnesota with Covid-19 was 194, for the seven days up to and including November 27th, this was up to 377, a rise of 94%, or 183 beds. But, over the same period, the average number of people in ICU in Minnesota without Covid-19 fell from 930 to 752, a fall of 19%, or 178 beds. In other words, the fall in non-Covid-19 ICU cases offset 97% of the surge in cases with Covid-19. Overall, as a result, total ICU cases surged by just 0.4%, or five beds, over this period.
Figure 4: ICU hospitalizations, seven day moving average
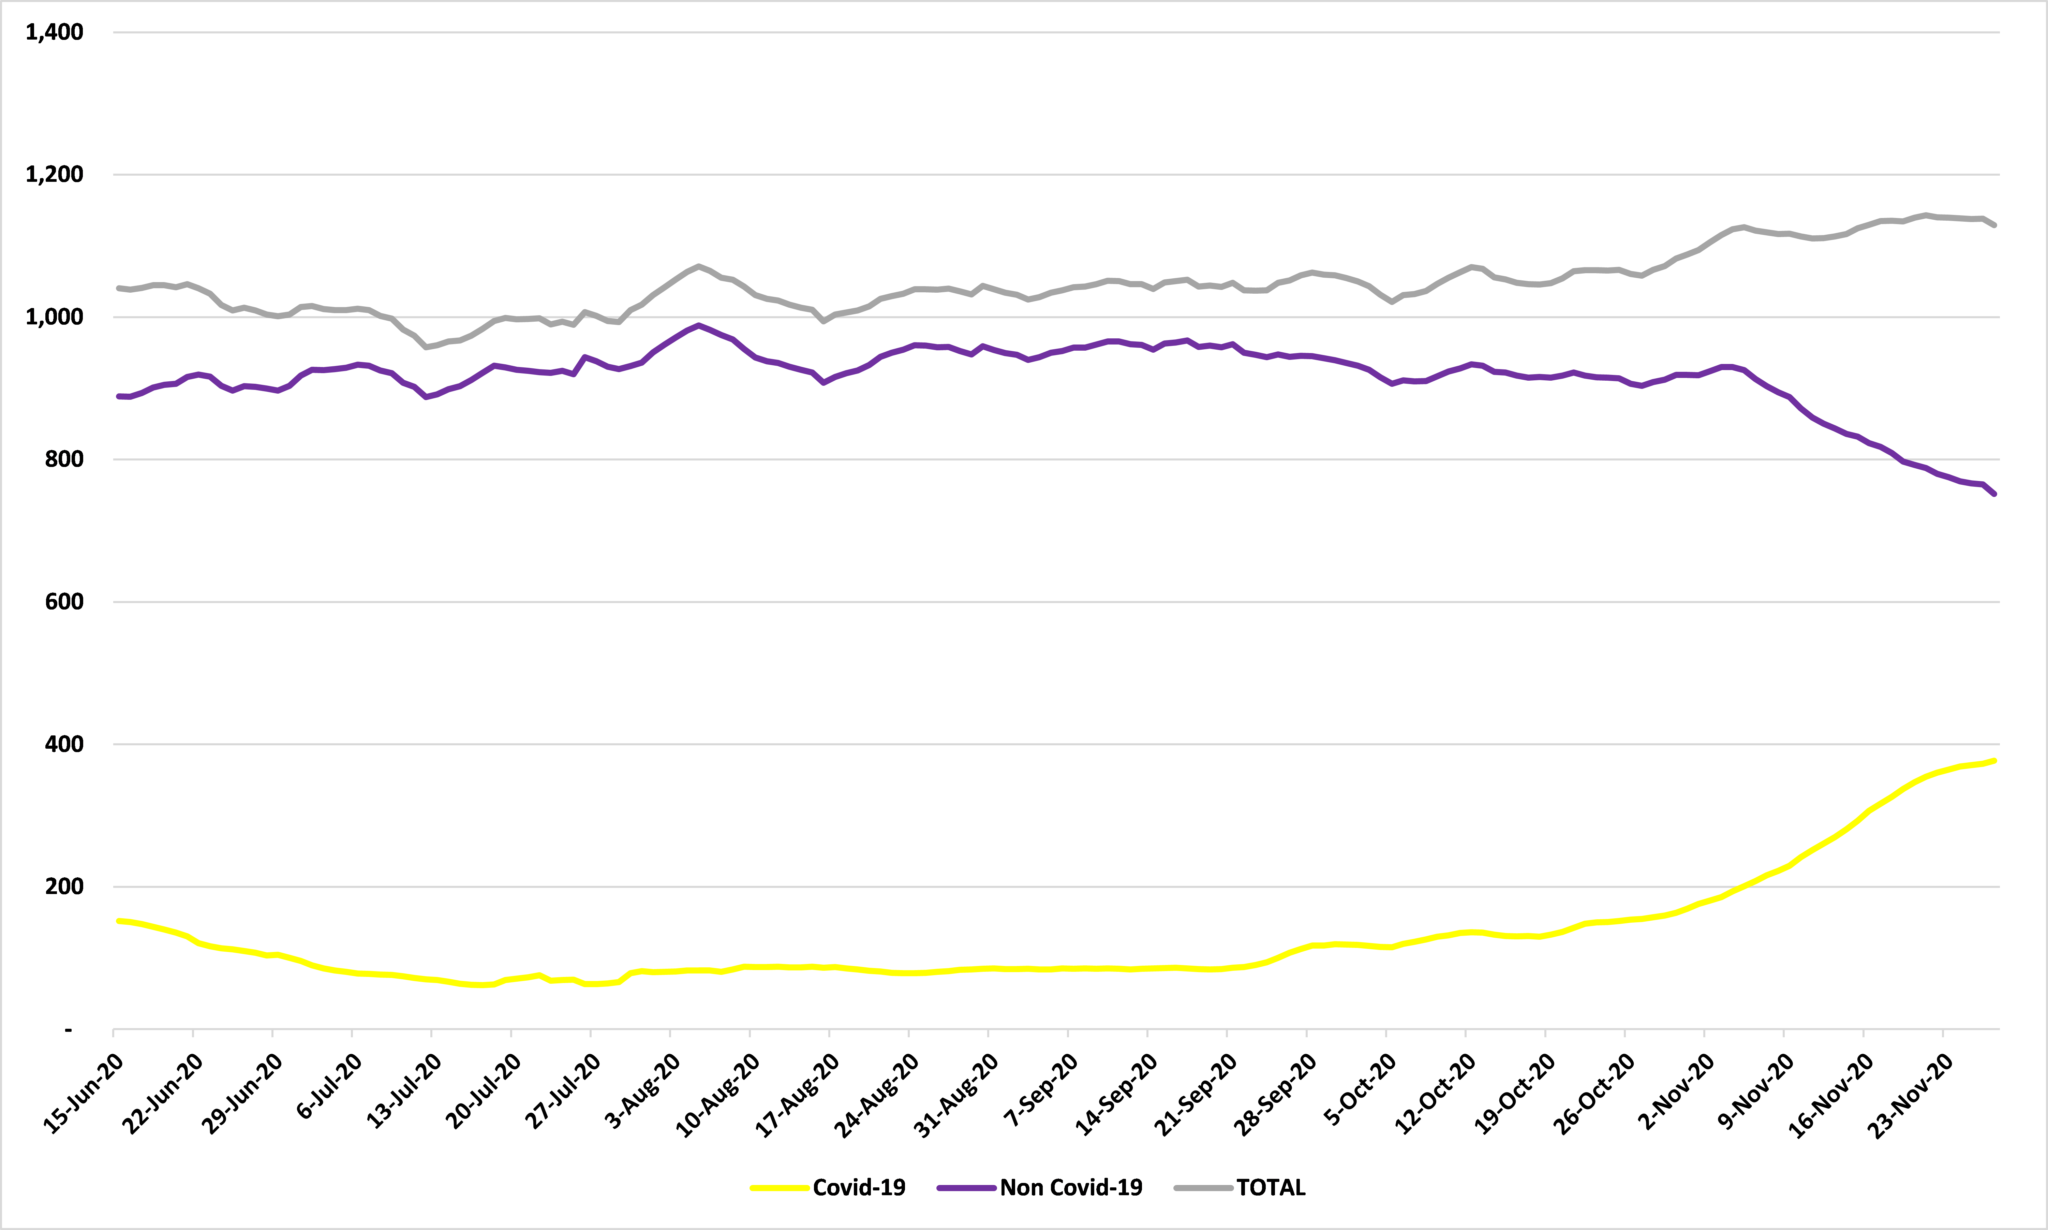
Source: Department of Health
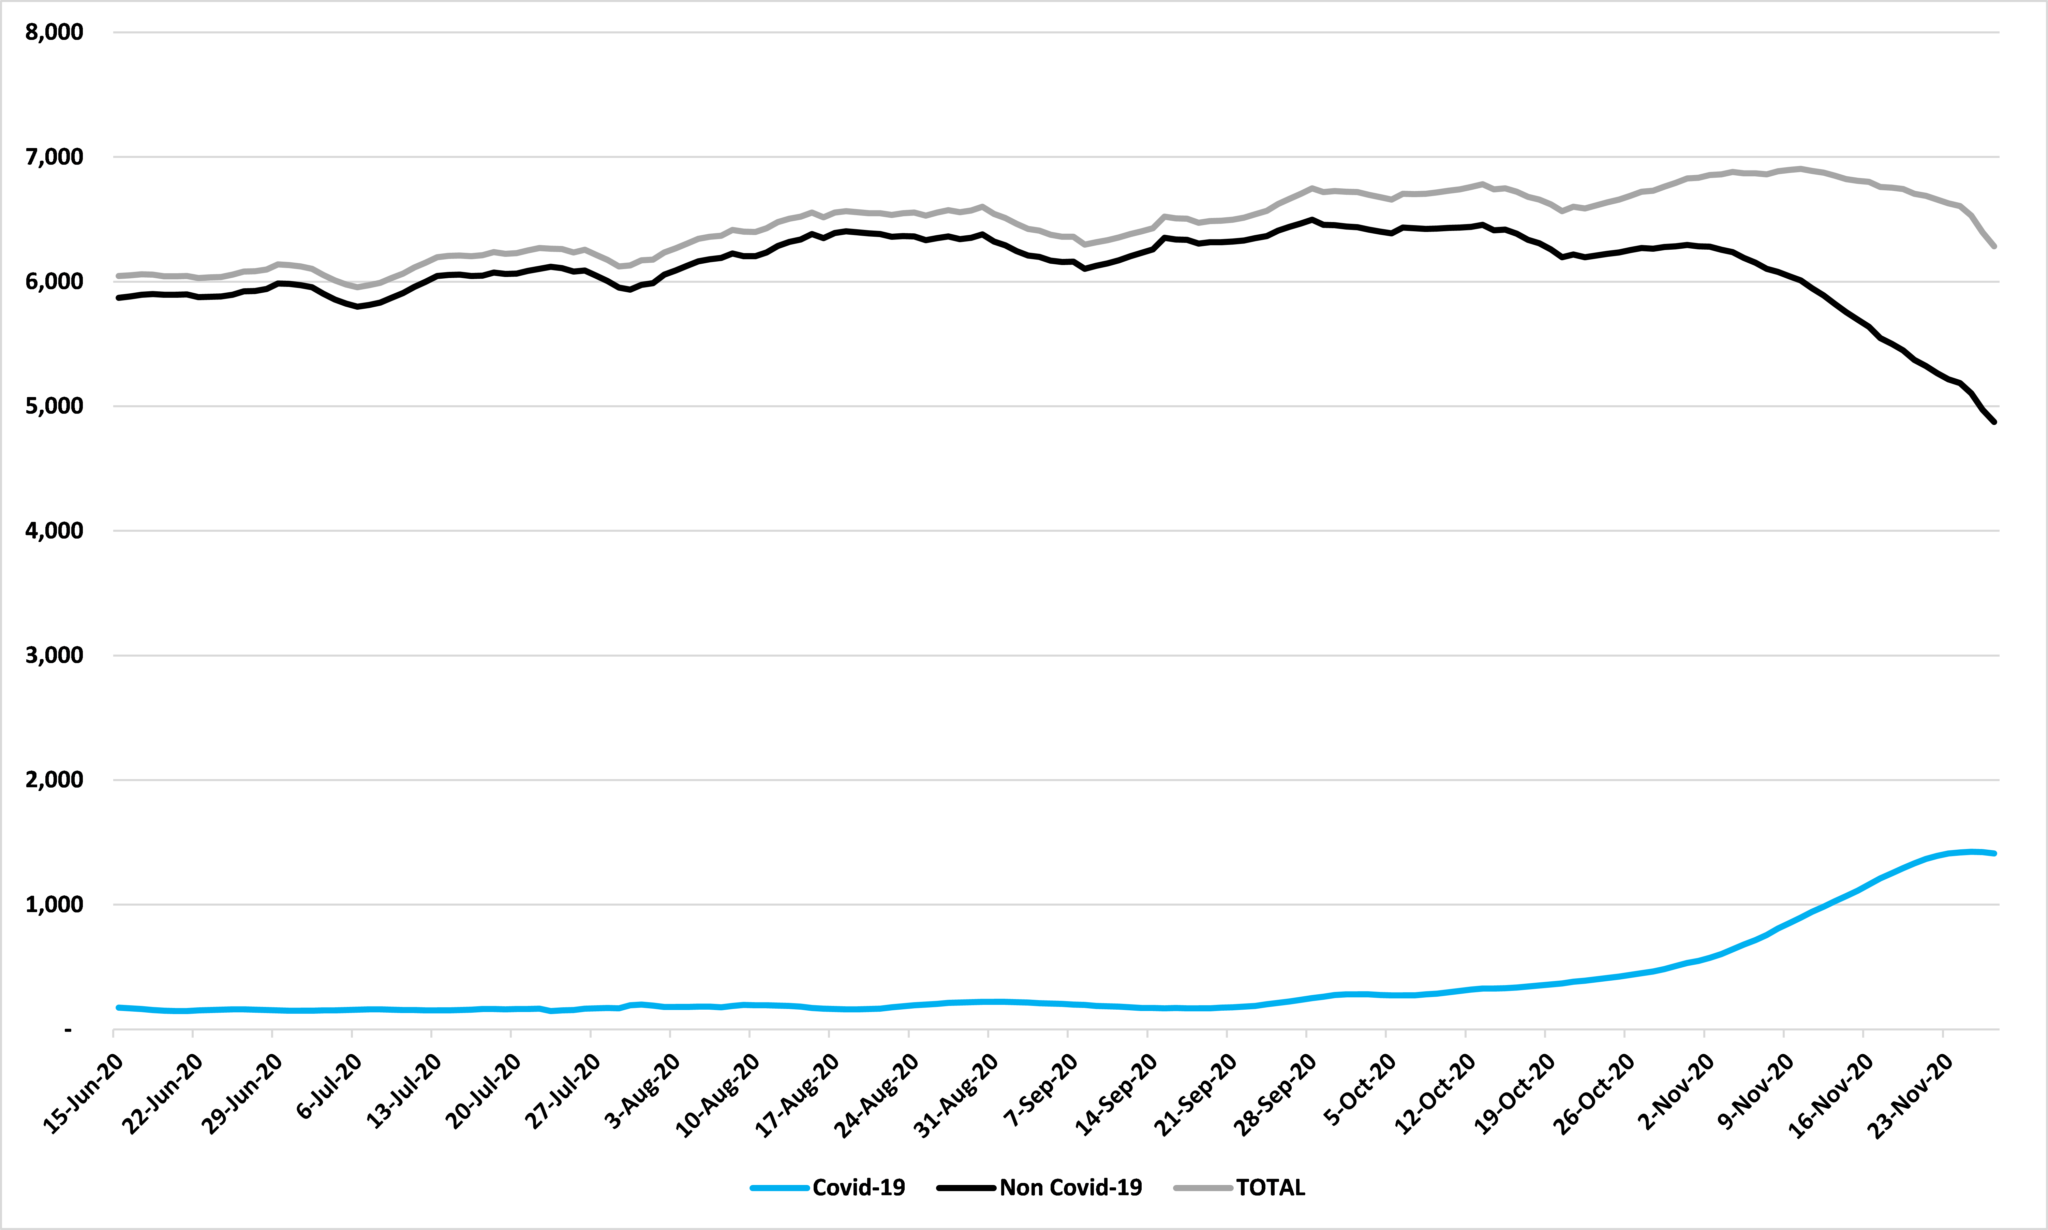
The same is true for non-ICU hospitalizations, as Figure 5 shows. In the seven days up to and including November 4th, the average number of people requiring non-ICU hospital treatment for Covid-19 in Minnesota was 642. For the seven days up to and including November 27th this was up to 1,411, a rise of 120%, or 769 beds. But, over the same period, the number of people requiring non-ICU hospital treatment in Minnesota without Covid-19 fell from 6,237 to 4,874, a fall of 22%, or 1,363 beds. In other words, the fall in non-Covid-19 non-ICU cases more than offset the surge in cases with Covid-19. Overall, as a result, total non-ICU hospitalizations have fallen by 9%, or 594 beds, over this period.
Figure 5: Non-ICU hospitalizations, seven day moving average
Source: Department of Health
As I’ve written before:
On the face of it, this seems strange. Why should non-Covid-19 hospitalizations be taking such a sharp fall? We are heading into flu season which typically sees hospital admissions rise, putting great pressure on hospital capacity even in years without Covid-19 to contend with. Why is this year so different? My guess is that many of these Covid-19 ICU hospitalizations are ones which would have occurred anyway given the usual seasonality, but are being logged as Covid-19 hospitalizations this year.
Whatever the reason, it is welcome good news.
John Phelan is an economist at the Center of the American Experiment.