Minnesota’s unemployment rate is up again, from 2.8% to 3.4% in a year
‘Minnesota Unemployment Increases to 3.4% in July’. So said an email from Minnesota’s Department of Employment and Economic Development (DEED) in an email this morning. Data from DEED shows that the unemployment rate is now 0.6 percentage points higher than it was a year ago – 2.8%. By contrast, over the same period, the rate for the United States generally has fallen by 0.2 percentage points, from 3.9% to 3.7%.
Minnesota is lagging the United States on job growth
Figure 1 shows how employment has changed in Minnesota and the United States generally since January 2017. Over that period, employment has risen by 3.4% nationally but by only 2.4% here in Minnesota.
Figure 1: Employment growth in Minnesota and the United States, January 2017-July 2019 (Jan 2017 = 100)
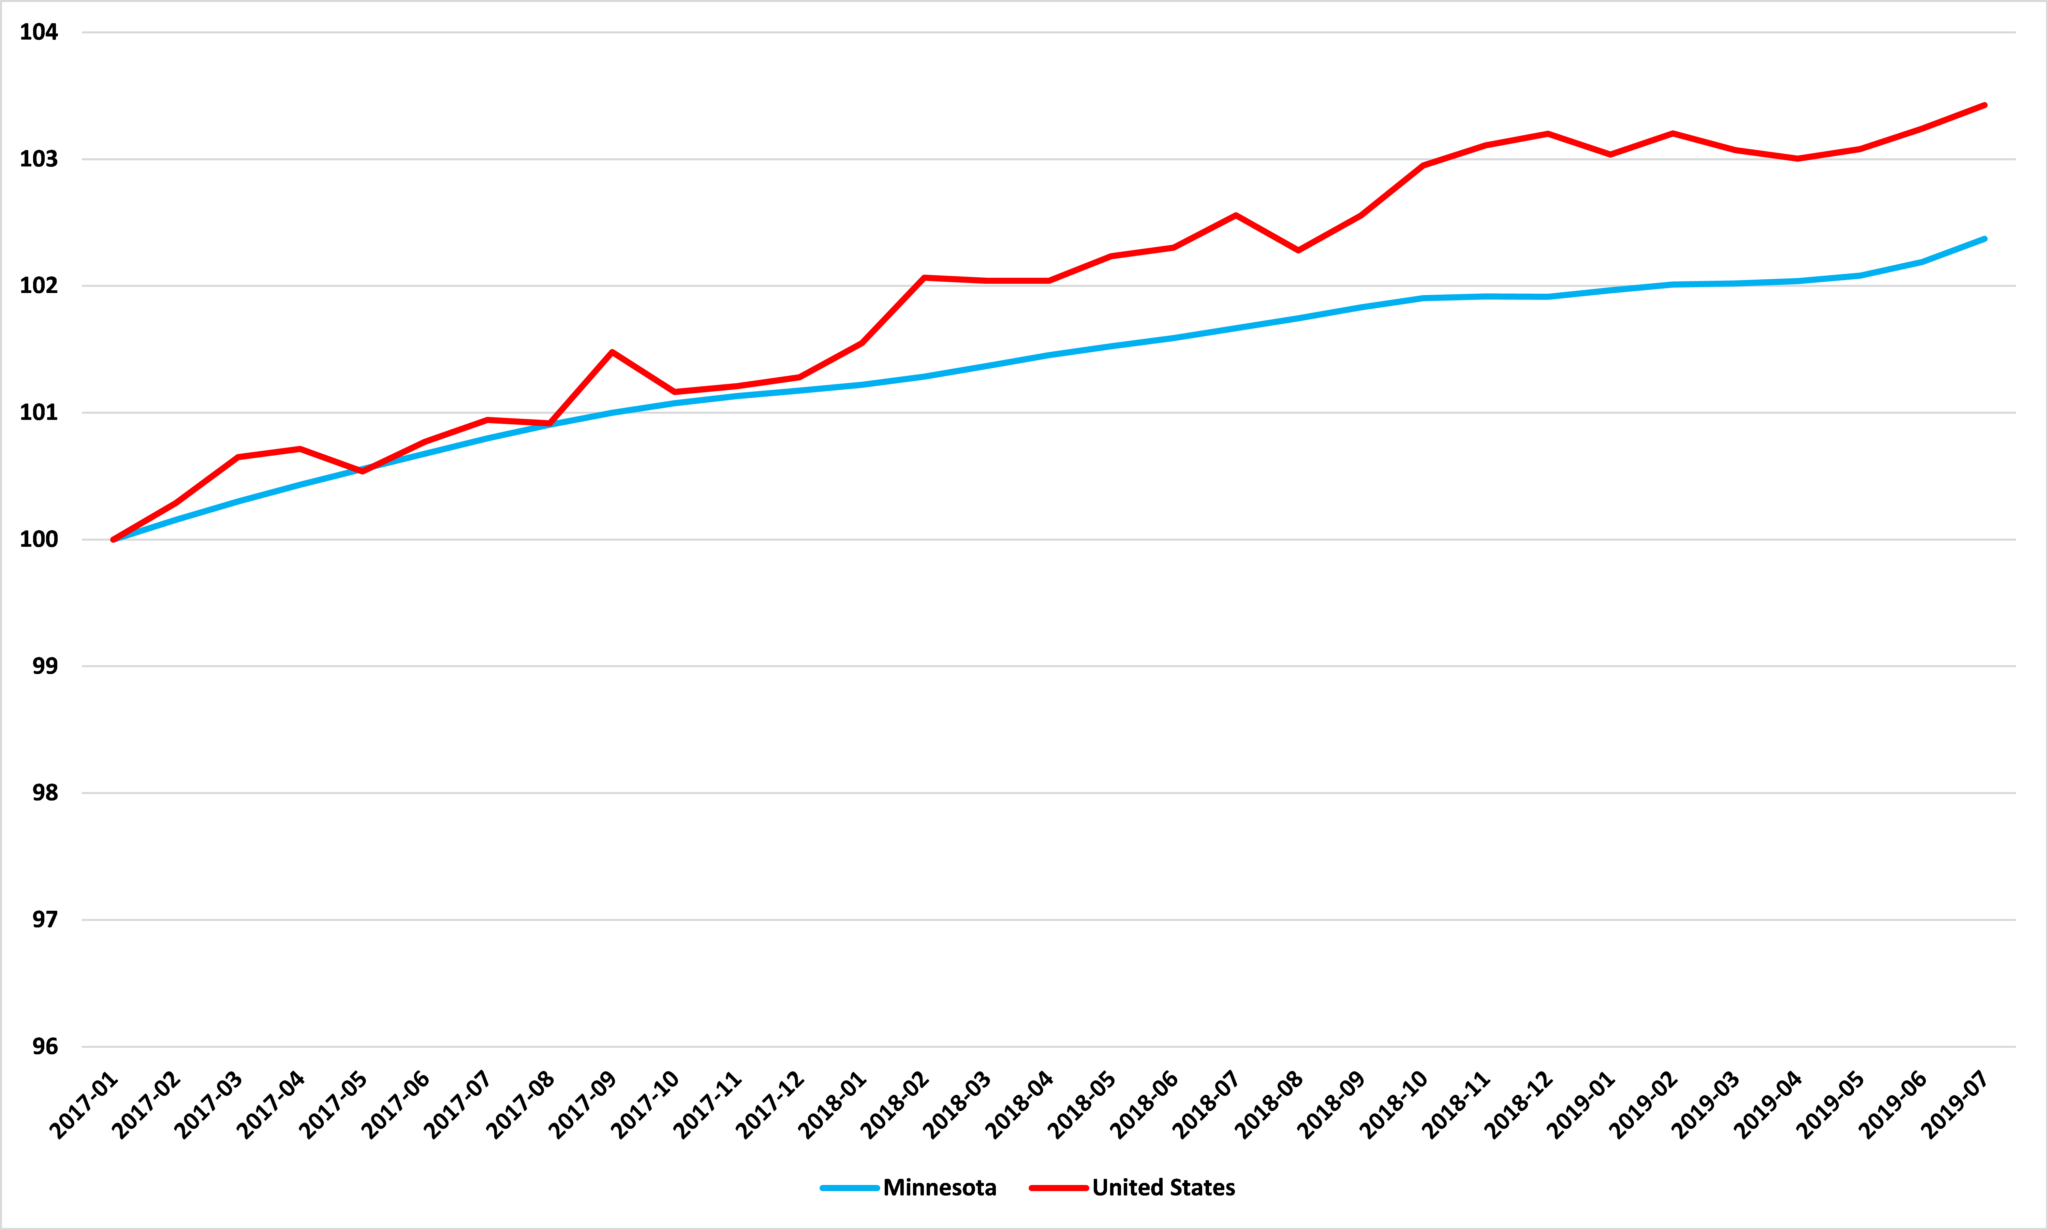
Source: Minnesota Department of Employment and Economic Development
Minnesota is leading the United States on unemployment growth
Figure 2 shows how unemployment has changed in Minnesota and the United States generally since January 2017. Over that period, the number of people unemployment has fallen by 9.4% in Minnesota, but by 20.7% nationally. Worryingly, the fall in the number of unemployed people in Minnesota stopped dead in August last year and the number has been rising ever since. Since August 2018, the number of unemployed people in Minnesota has risen by 22.1%: nationally, it has fallen by 2.7%.
Figure 2: Unemployment growth in Minnesota and the United States, January 2017-July 2019 (Jan 2017 = 100)
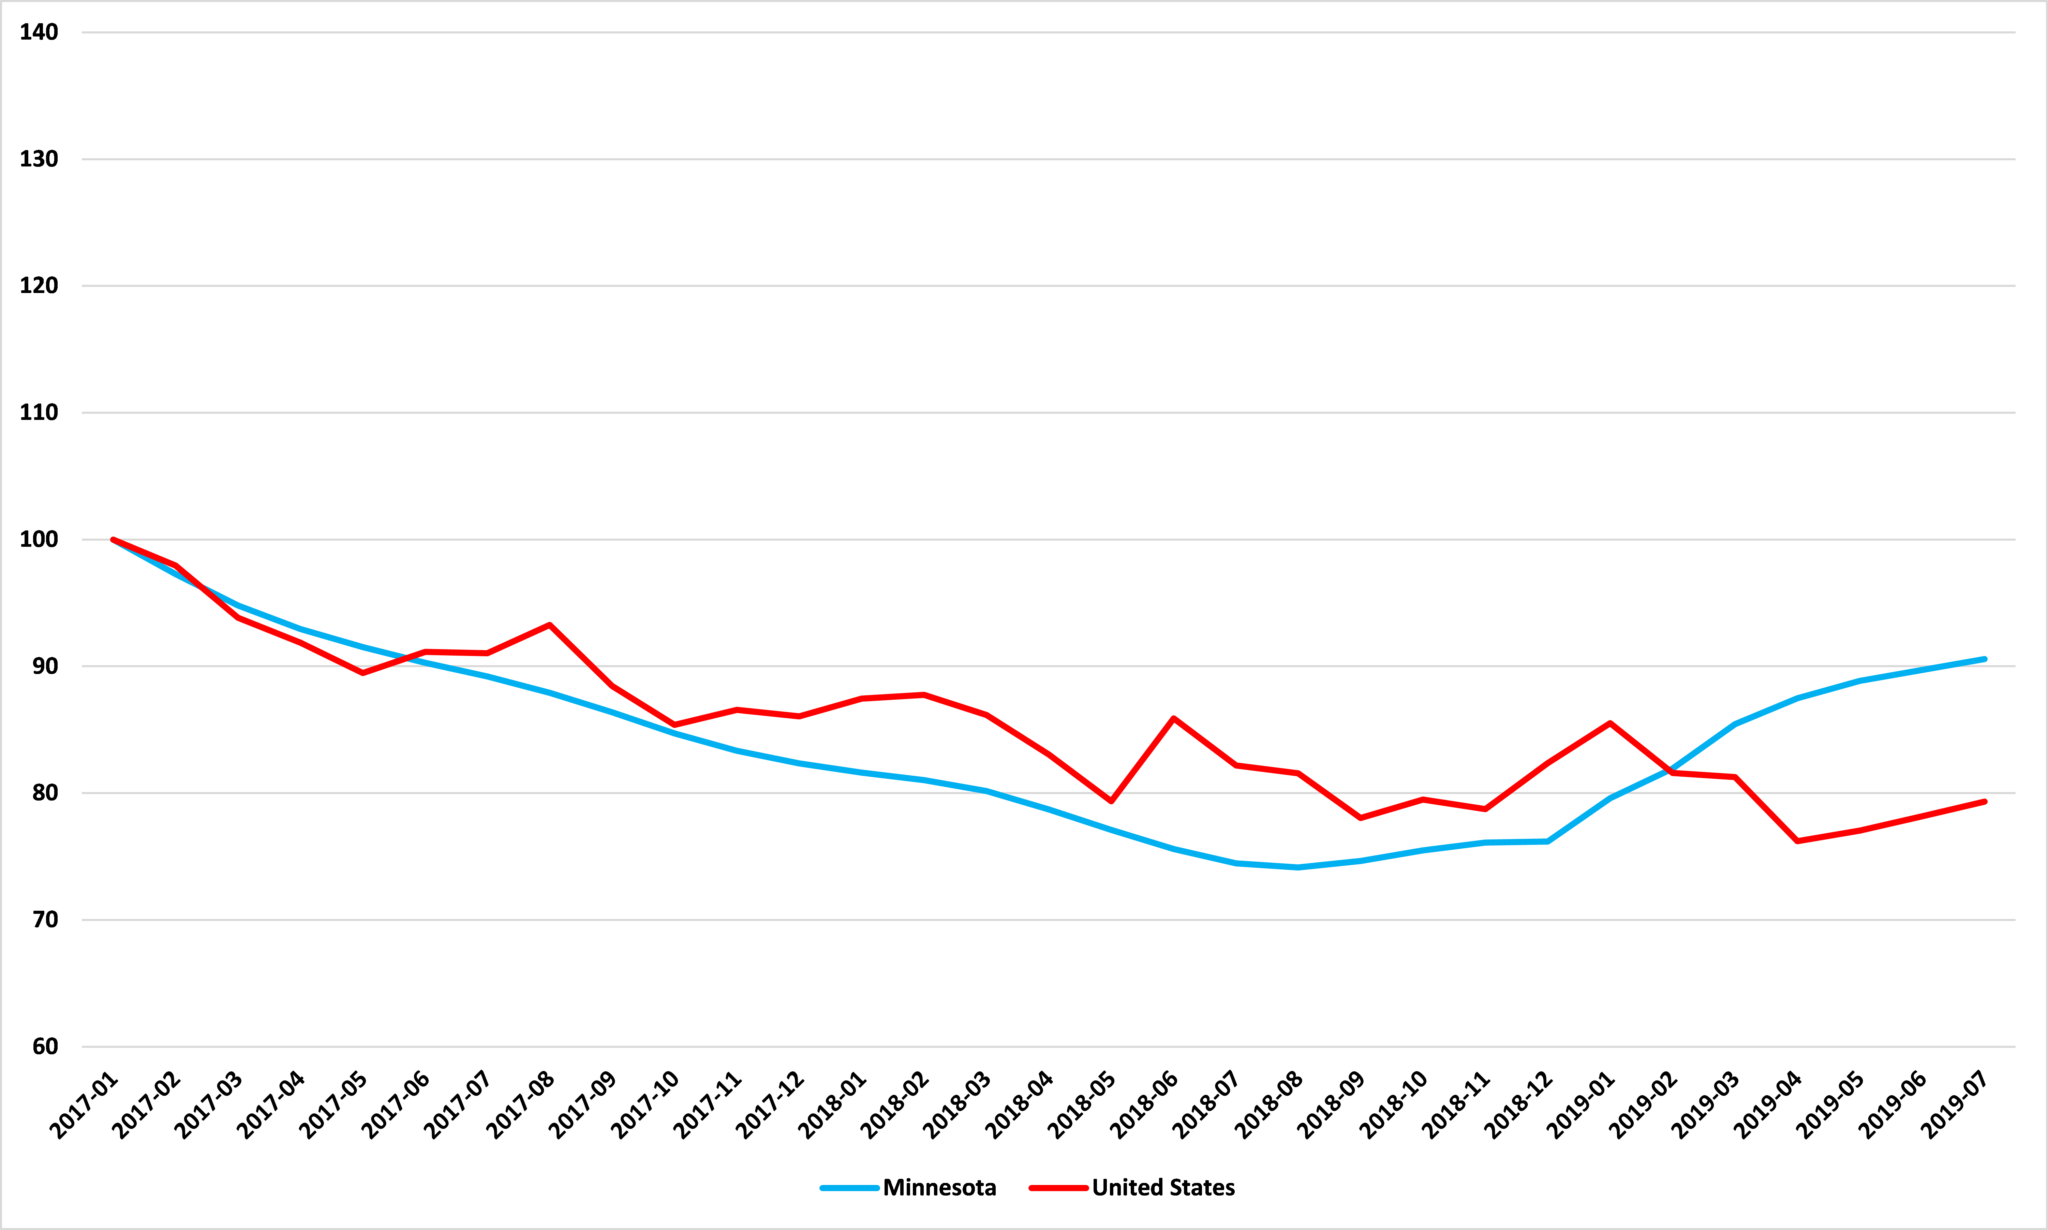
Source: Minnesota Department of Employment and Economic Development
Minnesota leads other states on population growth and unemployment growth, but lags on job growth
As I wrote on Tuesday, between June 2018 and June 2019 Minnesota has had faster population and unemployment growth than other states, but lower employment growth.
Figure 3 shows that Minnesota’s population growth over that period – 0.9% – ranked 17th nationally and slightly led the national average of 0.8%.
Figure 3: Change in population, June 2018 to June 2019
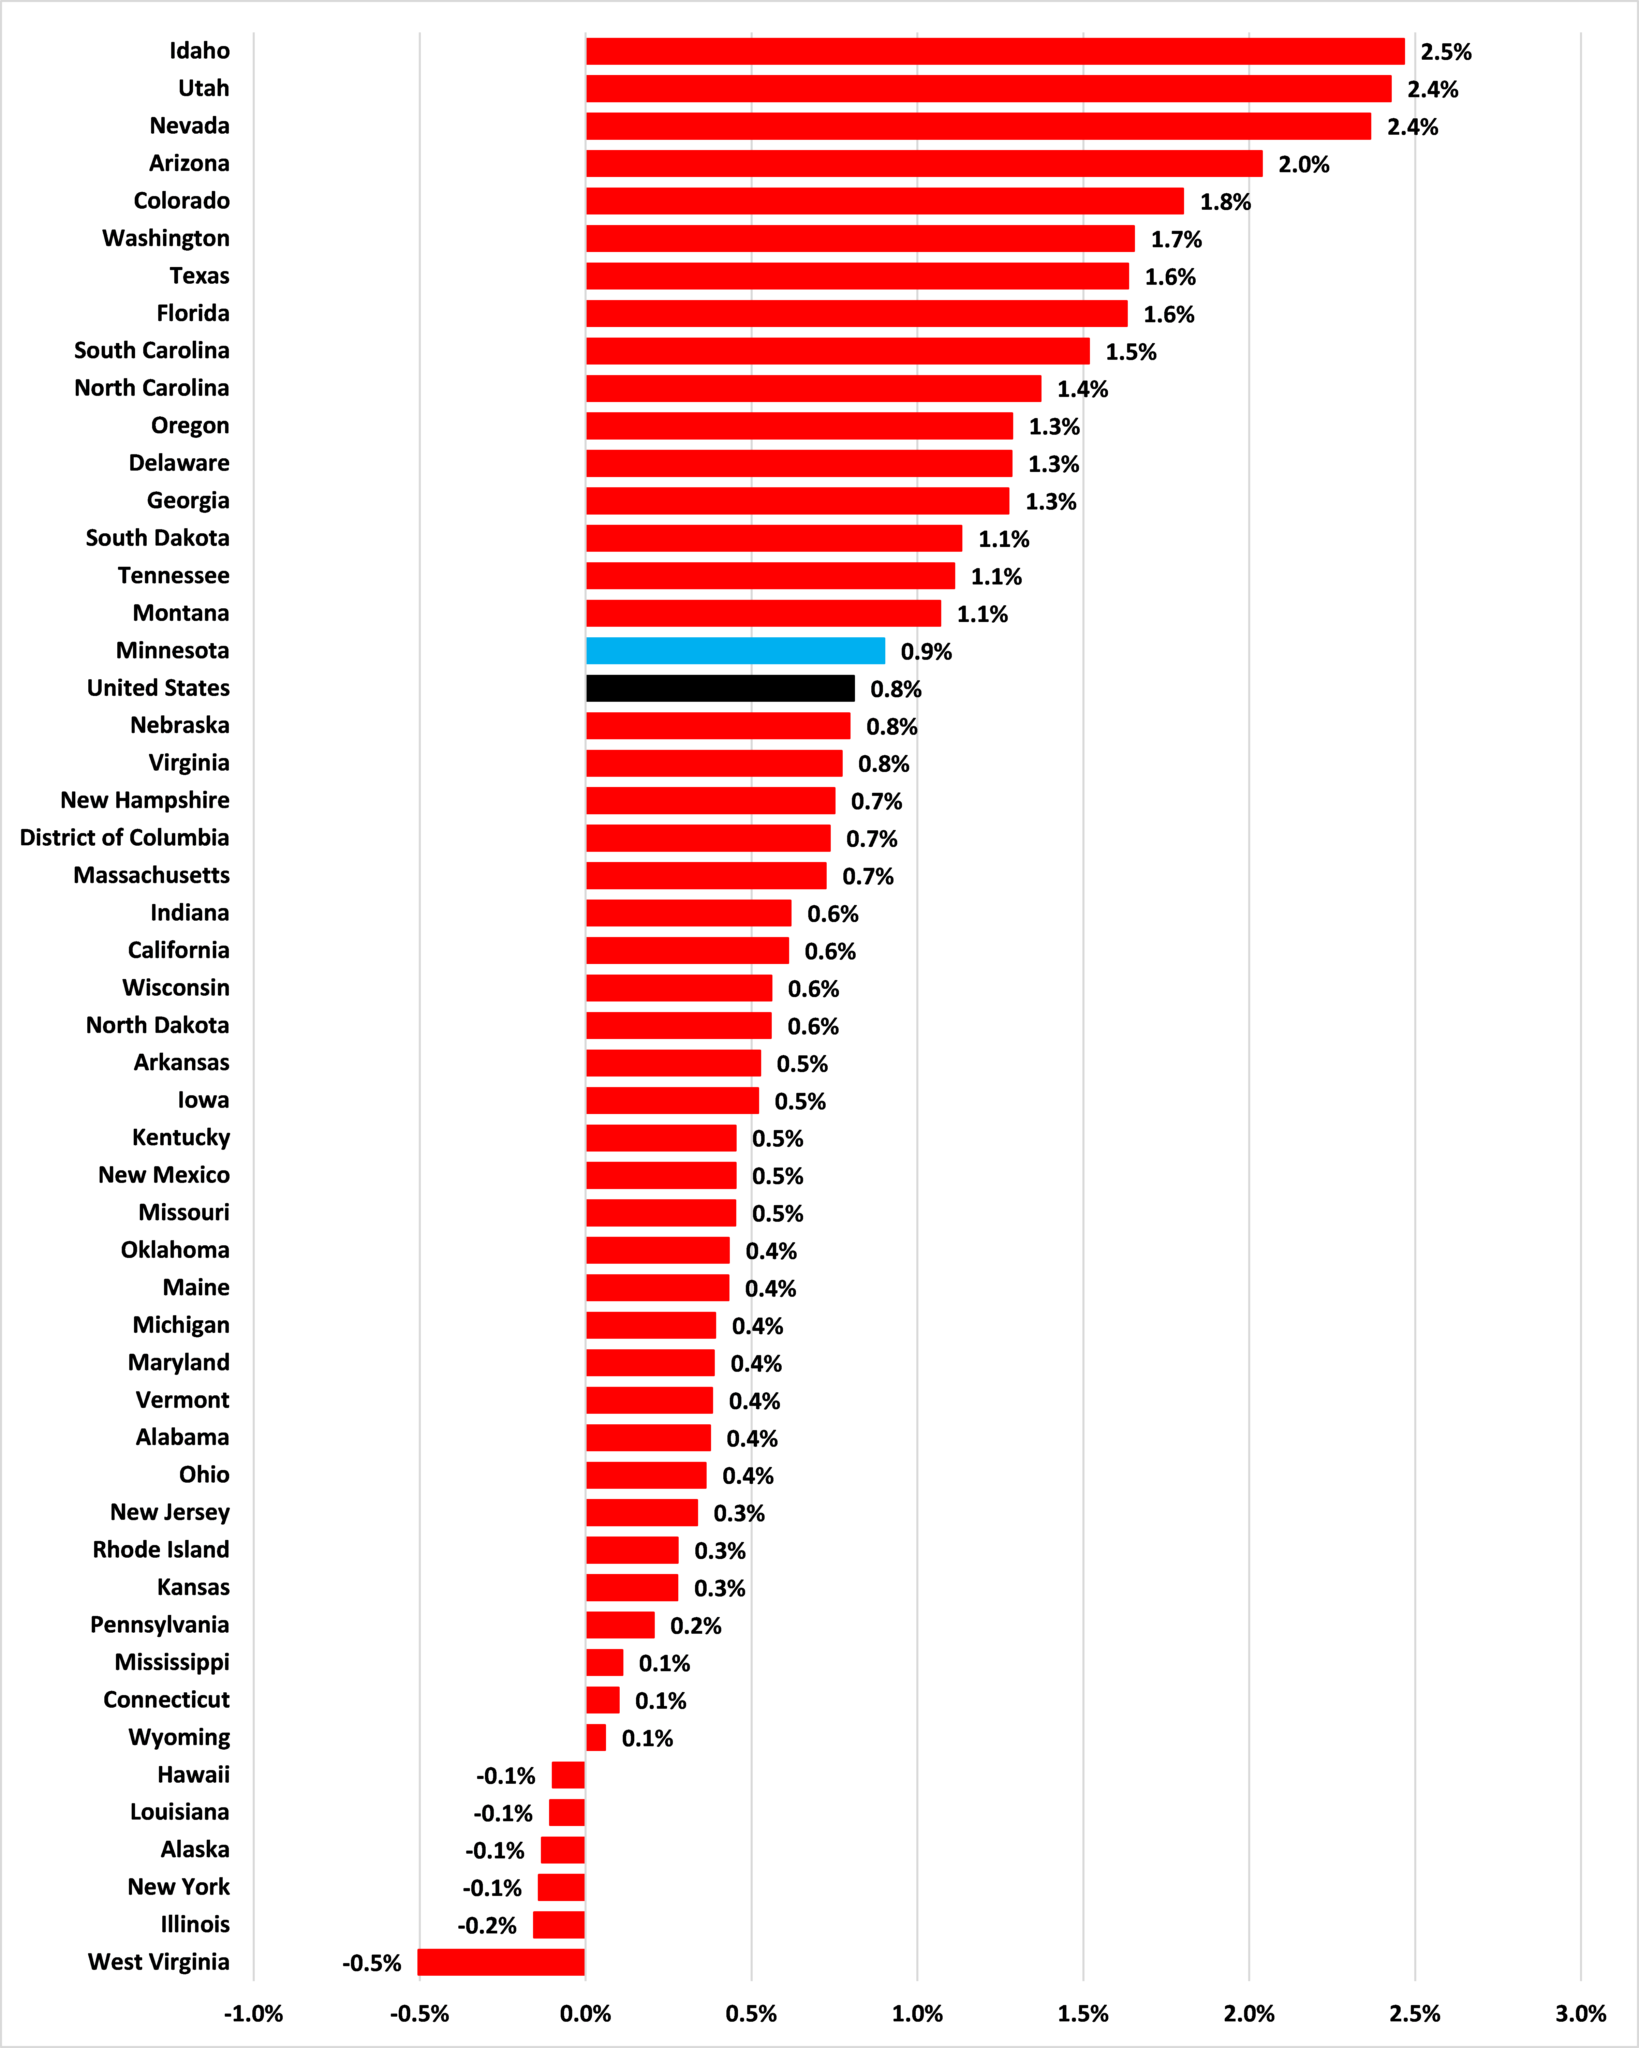
Source: Bureau of Labor Statistics
Figure 4 shows that Minnesota’s employment growth over that period – 0.6% – ranked 34th nationally, somewhat behind the national average of 1.0%.
Figure 4: Change in employment, June 2018 to June 2019
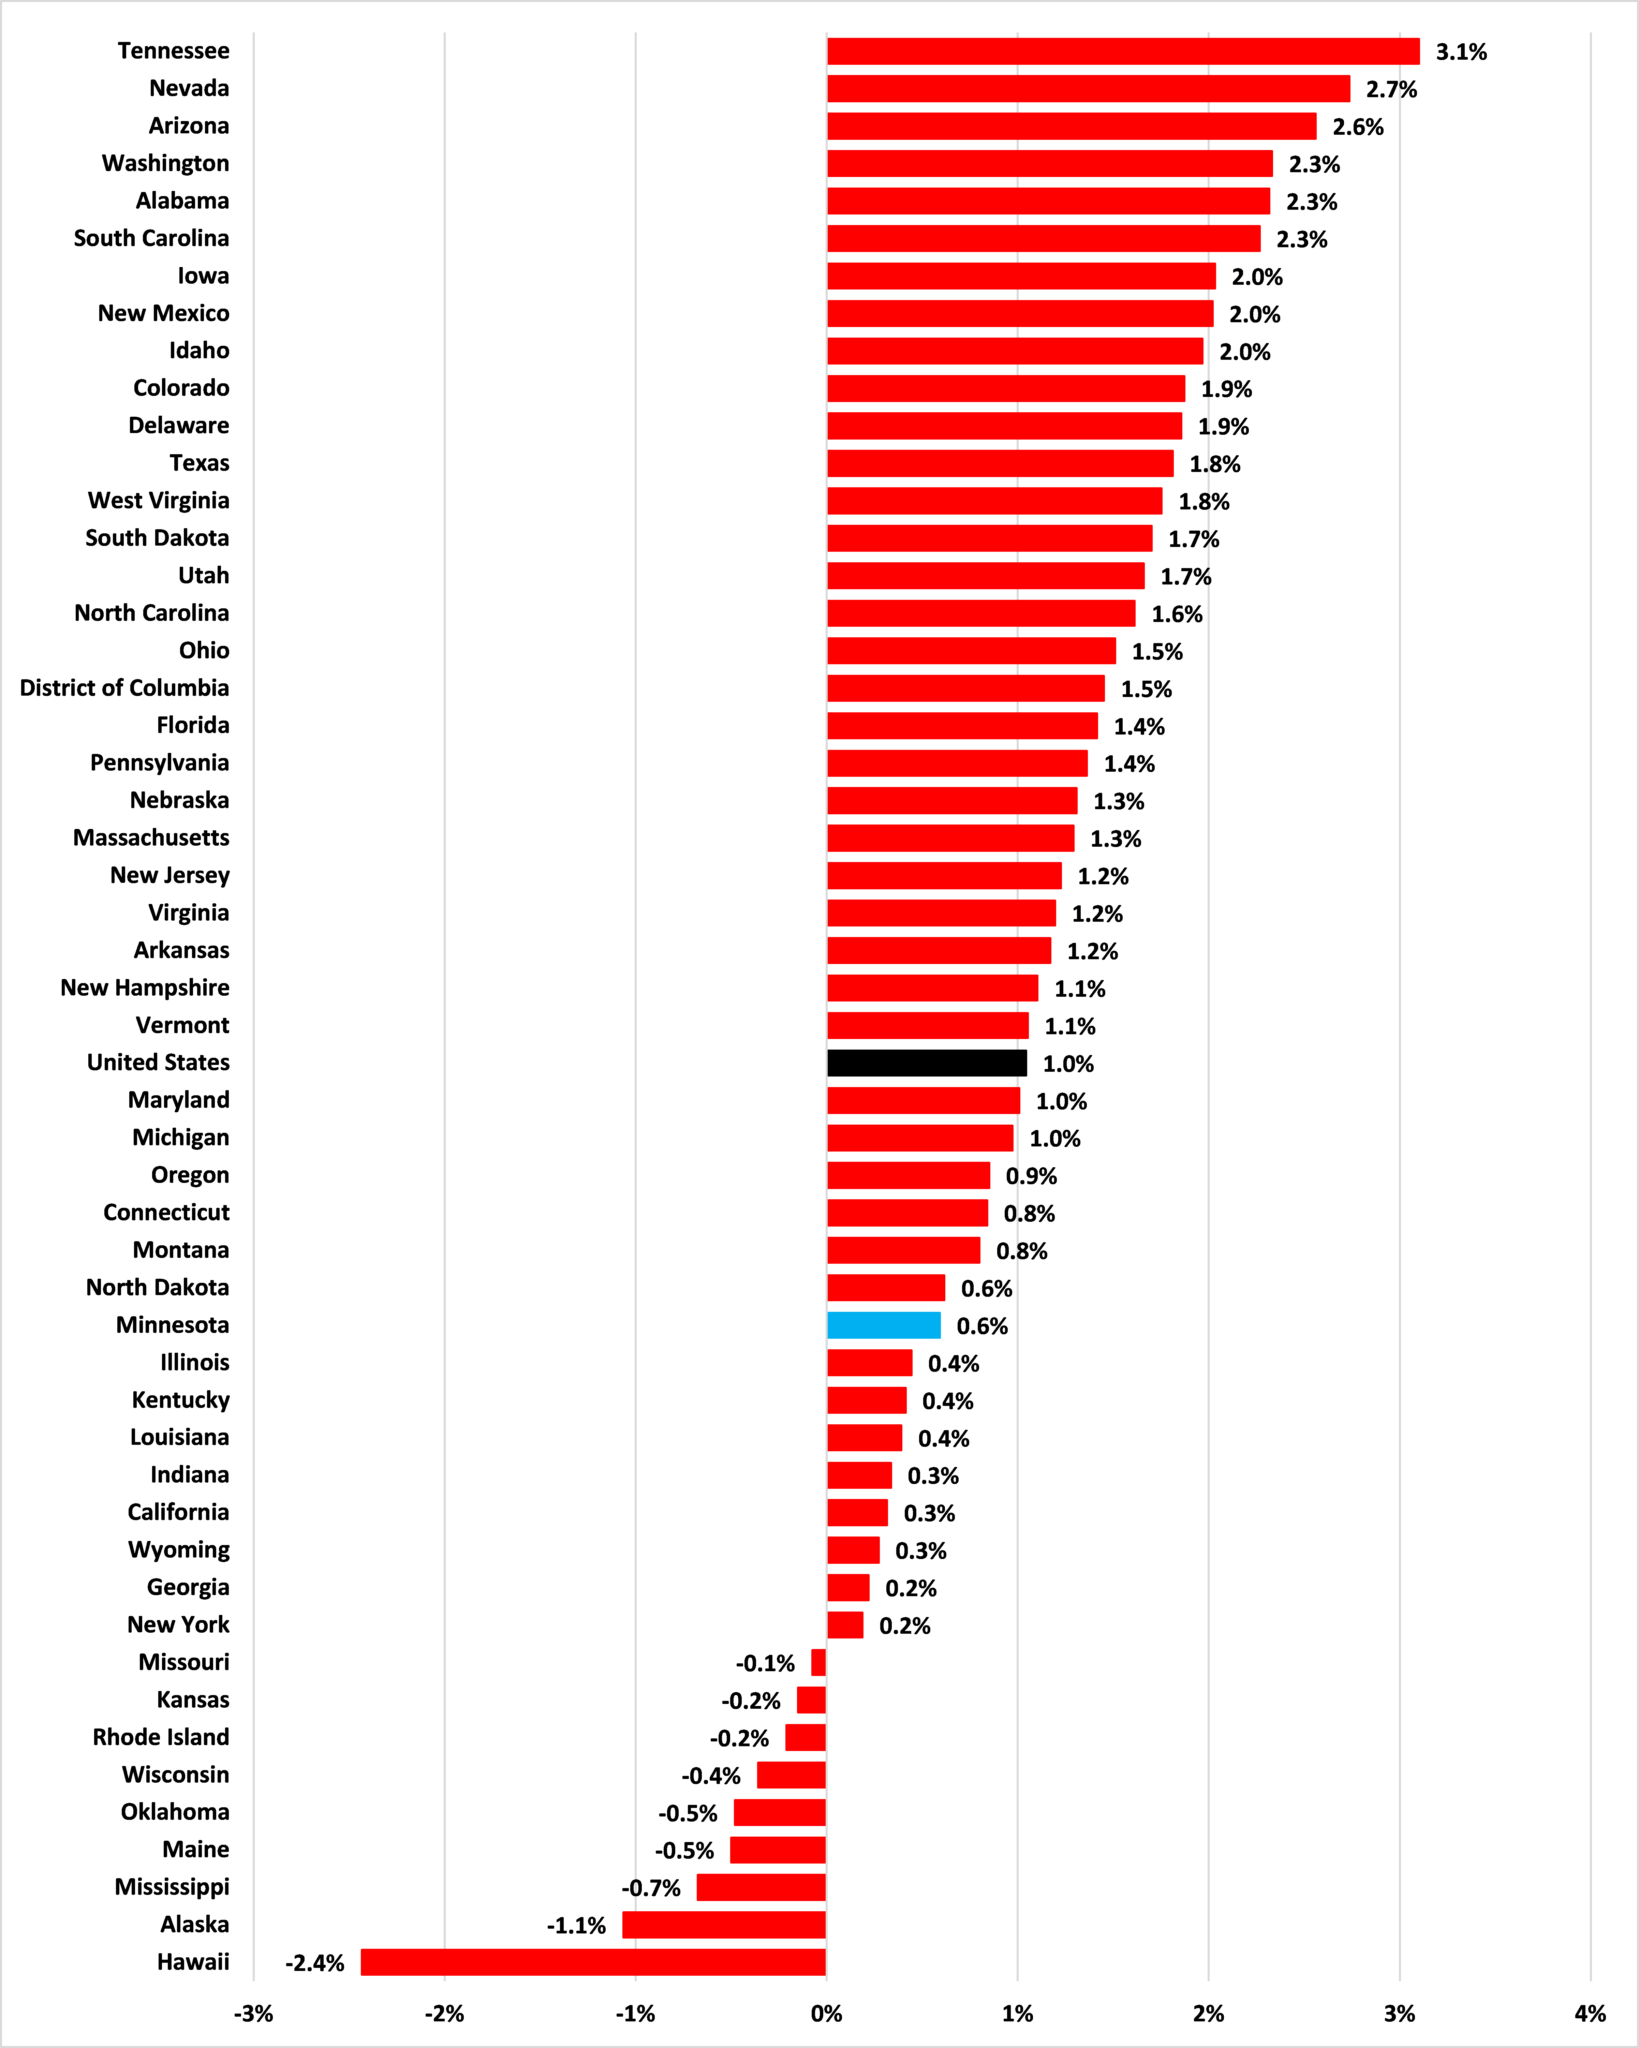
Source: Bureau of Labor Statistics
Figure 5 shows that the growth in the number of unemployed people in Minnesota over that period – 18.7% – ranked 1st nationally, well ahead of the national average which was actually a fall of 2.8%.
Figure 5: Change in unemployment, June 2018 to June 2019
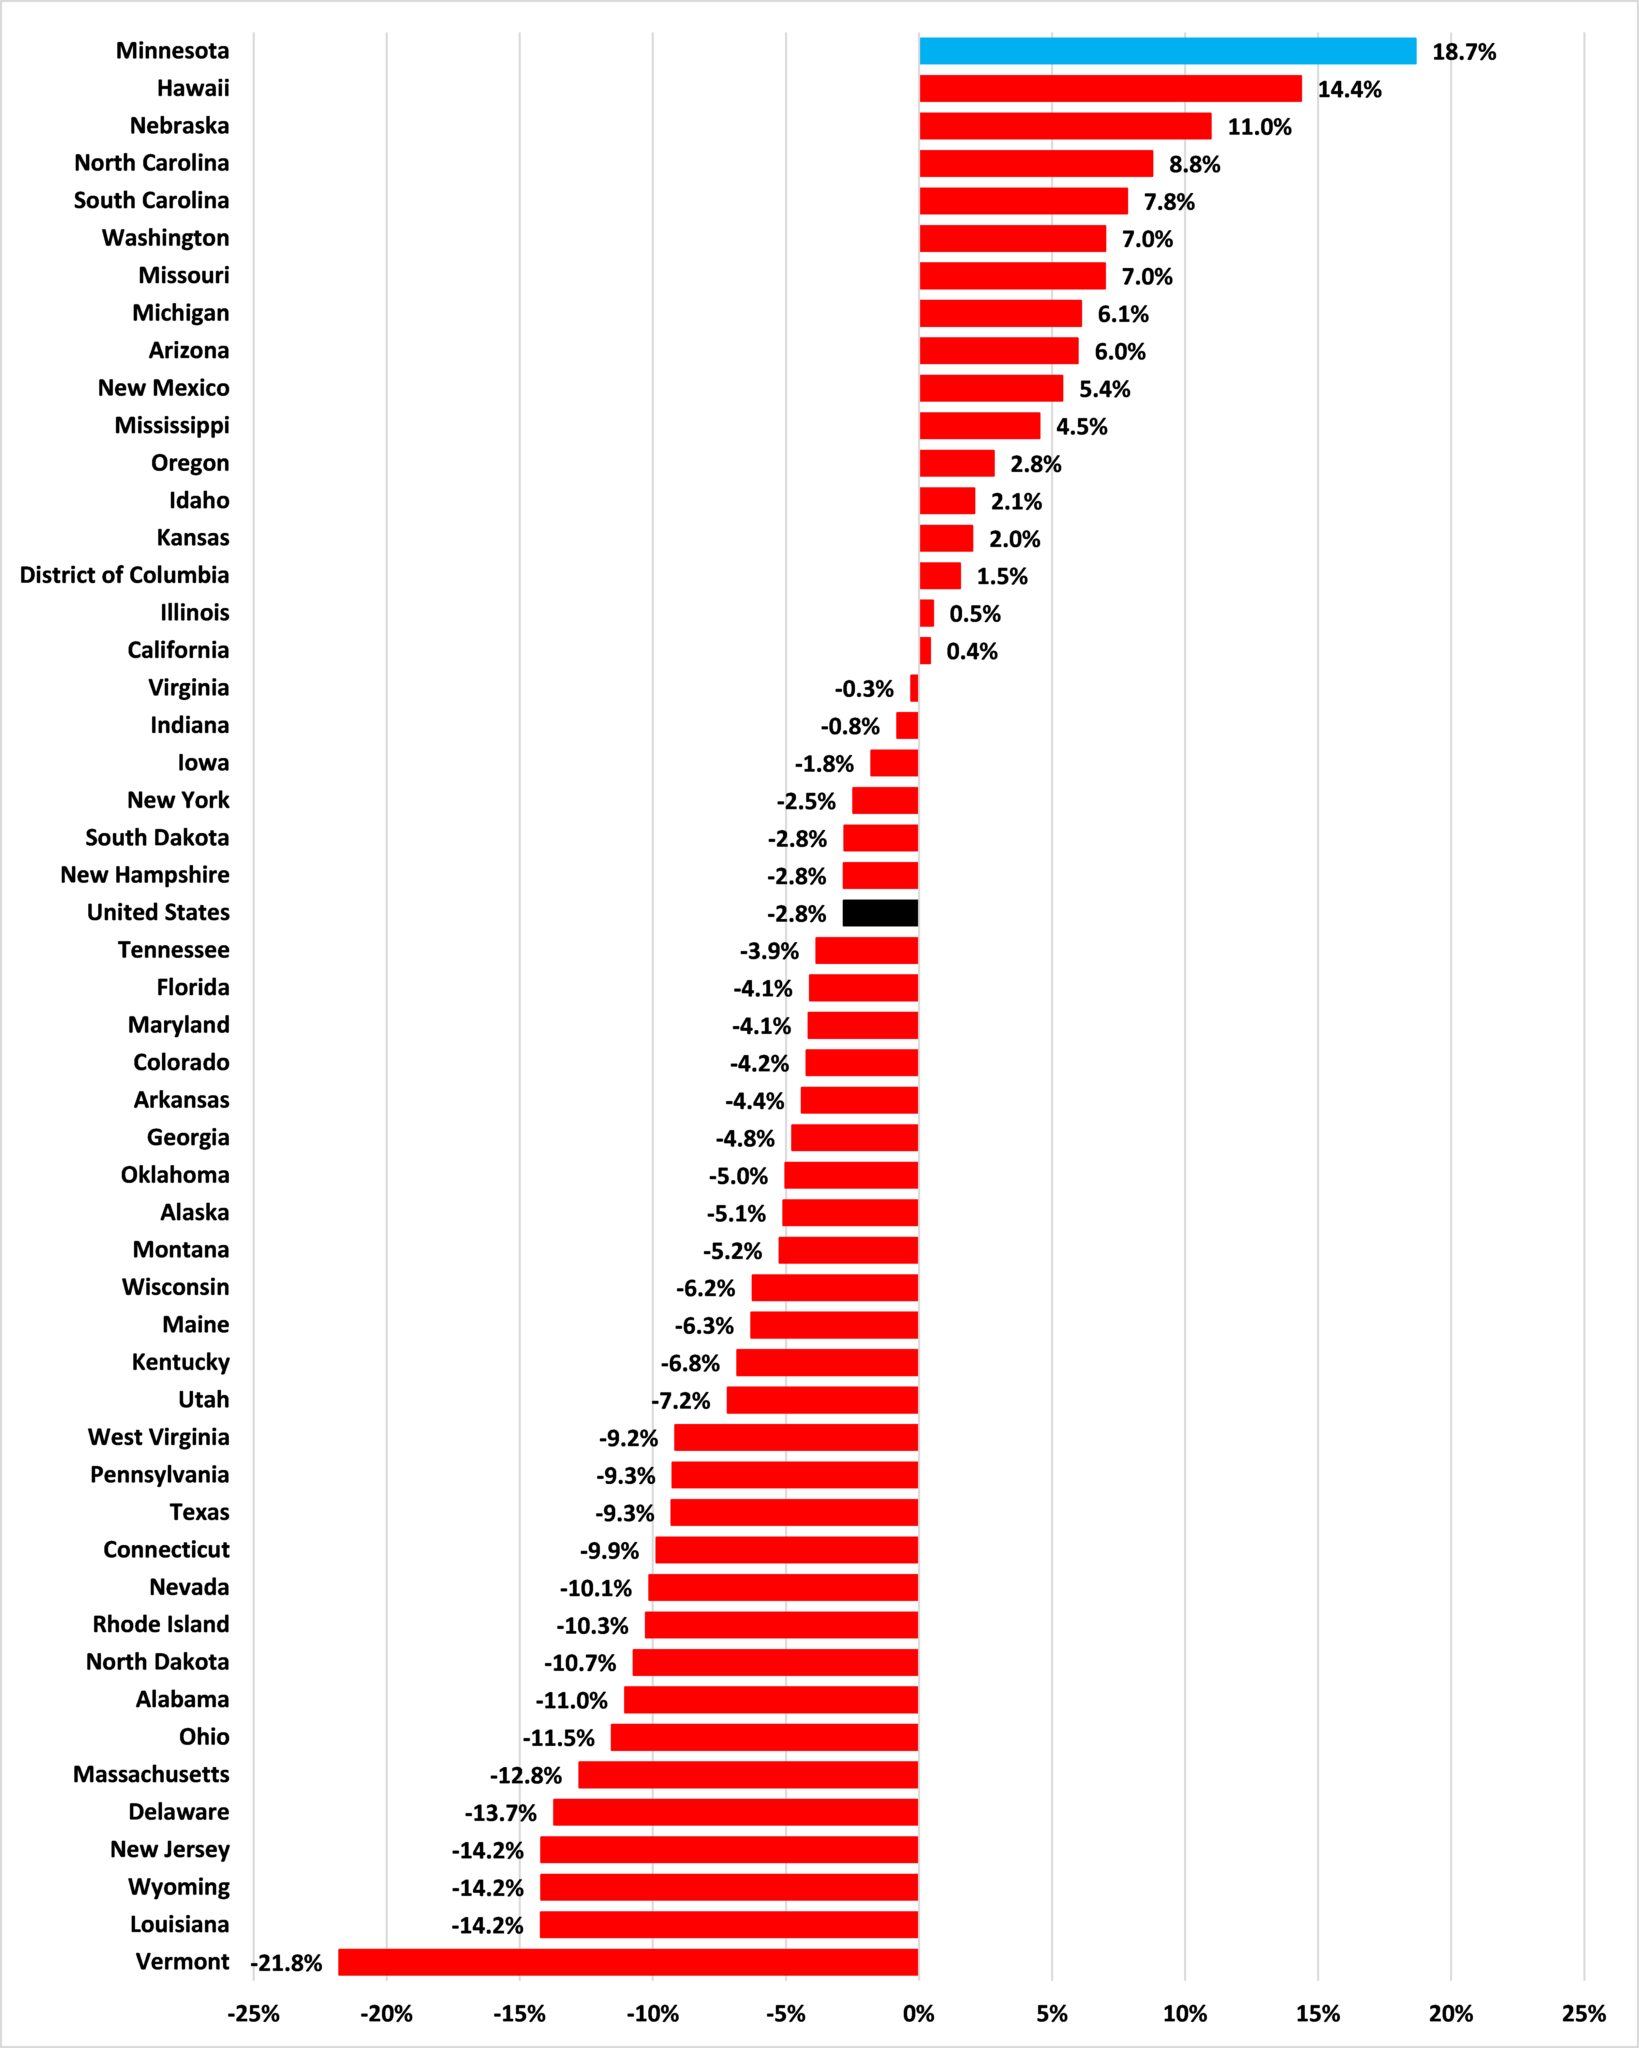
Source: Bureau of Labor Statistics
It is often said to me that Minnesota has one of the strongest economies in the United States. I always ask what measure this is based this on. As I noted recently, Minnesota had the the 36th fastest growing economy in the United States in the first quarter of 2019. This was the third consecutive quarter in which Minnesota’s economy grew more slowly than that of the United States generally. And now we can add to that this concerning labor market data.
John Phelan is an economist at the Center of the American Experiment.