As COVID-19 numbers improve, the media continues to scaremonger
COVID “doesn’t discriminate by age”: Serious cases on the rise in younger adults
So ran an MPR News headline at the weekend. I last wrote about this in November:
The Department of Health’s most recent Weekly COVID-19 Report contains data to Nov. 11. As summarized in Table 1 and Figure 1, these numbers show that if you are aged between 20 to 24 and are diagnosed with COVID-19, you have a 1.5 percent chance of being hospitalized, a 0.2 percent chance of needing intensive care (ICU) treatment, and a 0.004 percent chance of dying with COVID-19.
Table 1: Chances of a COVID-19 diagnosis leading to hospitalization, ICU care, or death by age group

Source: Department of Health
Figure 1: Chances of a COVID-19 diagnosis leading to hospitalization, ICU care, or death by age group
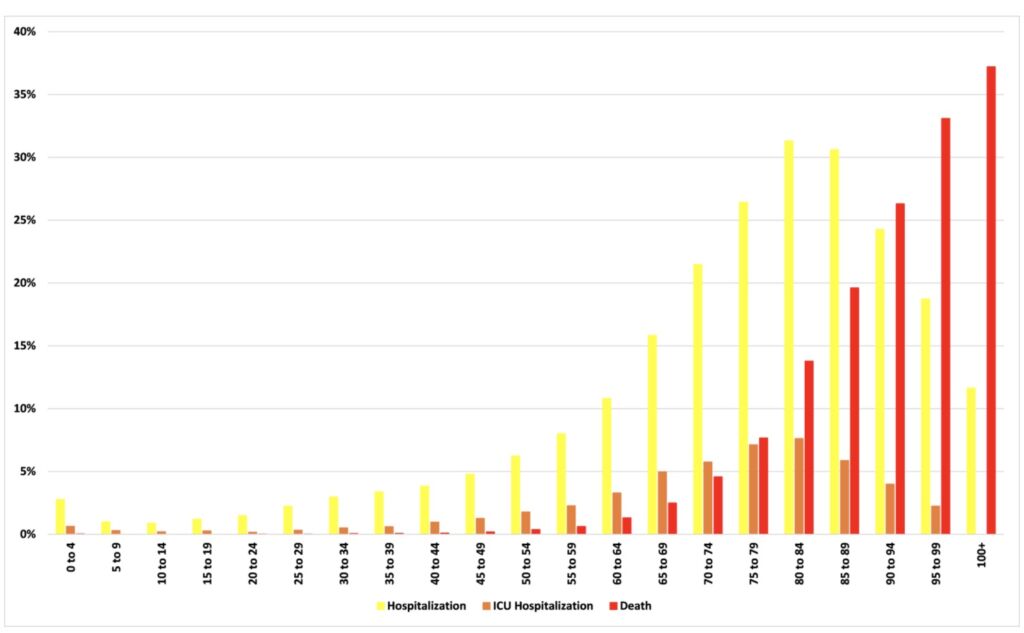
Source: Department of Health
The Department of Health’s most recent Weekly COVID-19 Report contains data to April 29. The numbers for the period since Nov. 11 are summarized in Table 2 and Figure 2. These numbers show that, over that period, if you were diagnosed with COVID-19 and aged between 20 and 24, you had a 1.2 percent chance of being hospitalized, a 0.1 percent chance of needing intensive care (ICU) treatment, and a 0.009 percent chance of dying with COVID-19.
Table 2: Chances of a COVID-19 diagnosis leading to hospitalization, ICU care, or death by age group, Nov. 11, 2020 to April 29, 2021

Source: Department of Health
Figure 2: Chances of a COVID-19 diagnosis leading to hospitalization, ICU care, or death by age group, Nov. 11, 2020 to April 29, 2021
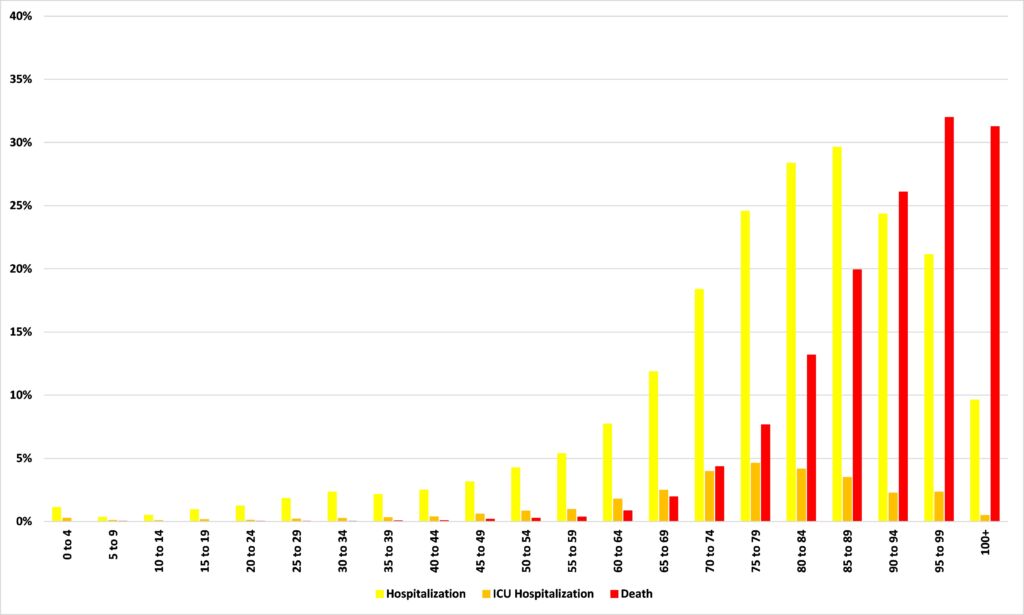
Source: Department of Health
You will note that, since Nov. 11, the odds of a 20 to 24 year old diagnosed with COVID-19 needing to be hospitalized or sent to ICU are actually lower than they were in the period before Nov. 11 — 1.5 percent and 0.2 percent respectively compared to 1.2 percent and 0.1 percent respectively for the period since. Table 3 and Figure 3 summarize this. We see that, since November, the odds of a diagnosed case resulting in hospitalization or ICU care have fallen for every single age group below 89. The odds of a diagnosed case needing ICU care have, indeed, fallen in every single age category.
Table 2: Percentage point change in the odds of a COVID-19 diagnosis leading to hospitalization, ICU care, or death from pre-Nov. 11, 2020 to post-Nov. 11, 2020

Source: Department of Health
Table 2: Percentage point change in the odds of a COVID-19 diagnosis leading to hospitalization, ICU care, or death from pre-Nov. 11, 2020 to post-Nov. 11, 2020
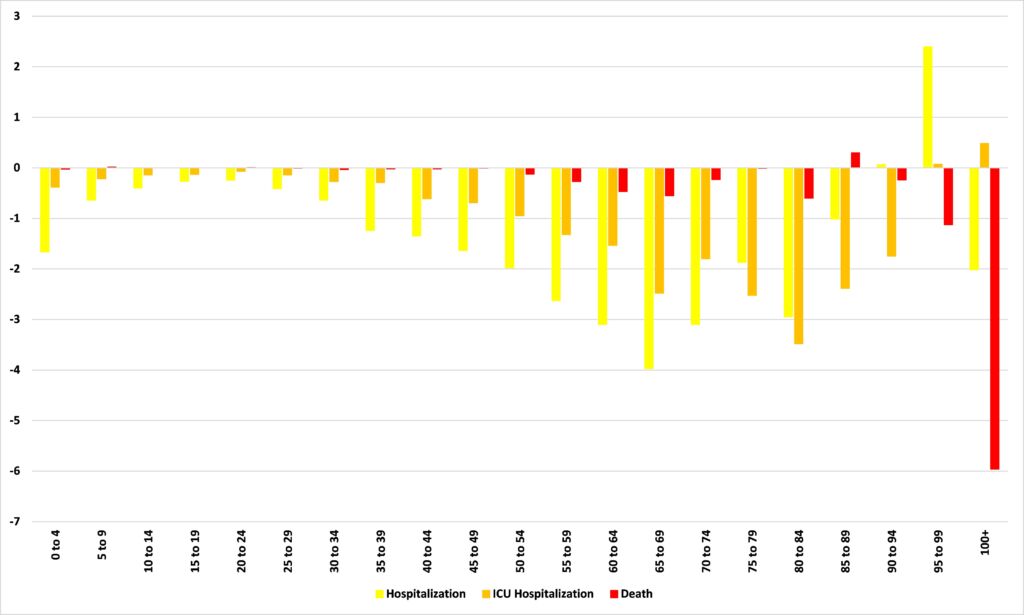
Source: Department of Health
This, as I’ve noted before, relates only to diagnosed cases. If we could add in ‘asymptomatic’ and other cases which are not diagnosed, all of the numbers in Table 2 and Figure 2 would fall.
The numbers for COVID-19 in Minnesota are moving in the right direction. The media doesn’t seem to want to tell you that.
John Phelan is an economist at the Center of the American Experiment.