Defying the odds, voter participation skyrockets in Minnesota
The biggest urban areas are leading the way.
Today, the Minnesota House of Representatives will be taking up HF3, the omnibus elections bill. The bill is a grab-bag of bad ideas: National Popular Vote, automatic voter registration, 16-, 17-teen year-olds voting, etc.
Ostensibly, the bill is designed to make it easier to vote in Minnesota. In reality, the bill is designed to widen the Democrats’ thin partisan advantage in state elections.
In fact, Minnesota already leads the nation in voter participation. In the 2020 election, Minnesota led the nation with a turnout of 80 percent, four points above 2nd-place Colorado. In 2022, Minnesota finished behind only Maine and Oregon in voter turnout.
Minnesotans are proud of their nation-leading participation in elections. So, what problem are we trying to fix?
Not only is the state’s voter turnout nation-leading, it is also much improved over recent years and at historic highs for the state. Much of the increase can be attributed to the state’s largest urban areas of Minneapolis and St. Paul. Here are the turnout numbers for off-year (non-Presidential) elections from 1998 through last year’s contest.
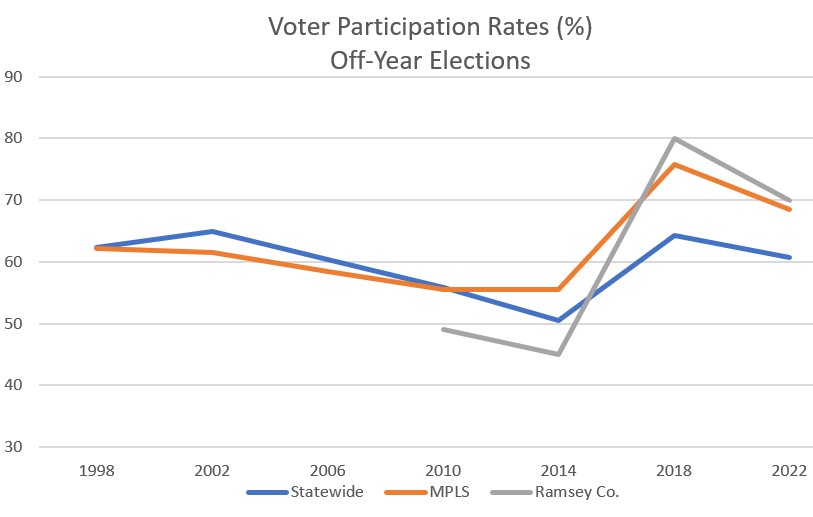
The blue line shows statewide participation. The red line represents voter participation in the City of Minneapolis. The gray line shows voter participation in Ramsey County, which includes the state’s second largest city, St. Paul.
[The Minneapolis data came from here. Statewide data came from the Minnesota Secretary of State’s office from here for 2022 and from here for earlier years. Ramsey County results from 2018 and 2022 are from here. Ramsey County results from 2010 and 2014 were taken from here.]
Through 2014, voter participation in Minneapolis and Ramsey County tracked at or below the state average. Participation in both jurisdictions jumped in 2018, pulling up the state average. Participation in both jurisdictions remained high in 2022, well above the state average.
So, what’s to account for this sudden change? Why did voter participation leap in the state’s largest urban areas, and, apparently, nowhere else?
If you were to believe leading political scientists, a large increase in urban voter participation is highly unlikely. A study conducted by the Pew Research Center finds that the more diverse an electorate, the lower the turnout rates are. Quoting the Pew report,
Voter turnout rates–or the share of U.S. citizens ages 18 and older who cast a ballot–also vary widely across racial and ethnic groups. White adults historically have had the highest rate of voter turnout: About two-thirds of eligible White adults (65%) voted in the 2016 election.
Pew finds that,
Black adults have also historically had relatively high rates of voter turnout, though typically slightly lower than White adults…
By contrast, Asian and Hispanic adults have had historically lower voter turnout rates, with about half reporting that they voted in 2016.
True, Pew studied turnout in Presidential years only. But they also note that,
White and Black adults are also more likely than Hispanic and Asian adults to say that they are registered to vote.
An earlier report by Pew notes that voter participation rates of recent immigrants lag behind the general population,
As immigrant eligible voters have grown in number since 2000, their voter turnout rates in presidential general elections have lagged those of U.S.-born voters. In 2016, 62% of U.S.-born eligible voters cast a vote, compared with 54% of foreign-born voters.
Even as their populations vote at higher and higher rates, the demographics of Minneapolis and Ramsey County have become more diverse in recent years.
The population of Minneapolis represented by non-Hispanic whites has fallen in every census, from 93 percent in 1970 to 58 percent in 2020.
Likewise, the share of Ramsey County’s population represented by non-Hispanic whites fell from 67 to 58 percent from 2010 to 2020.
As the core urban areas of Minnesota become more civic-minded than the rest of the state, election results are affected.
This difference can be illustrated by comparing the changes between the off-year 2010 and 2022 elections and voter participation in the City of Minneapolis.
In that 12-year interval, the population of Minneapolis increased by a little over 11 percent. The number of votes cast in Minneapolis increased by more than 38,000, or more than 21 percent. The vast majority of these additional votes went to Democratic candidates.
The two closest statewide races in 2022–for Attorney General and State Auditor–were decided by margins of 20,815 and 8,435, respectively, out of millions of votes cast.
In other words, had Minneapolitans participated in the 2022 election as the same rate as the rest of the state, a rate which the city has historically lagged behind, the outcome in at least one of those two races would have been reversed.
As we enter the 2024 election cycle, these strange phenomena deserve closer scrutiny.