Minnesota is already a leader in welfare spending. Gov. Walz wants to spend even more
Last week, the Star Tribune reported:
Thousands of Minnesota families living in poverty will see a boost in monthly relief payments and will no longer have to meet cumbersome paperwork requirements to prove they are eligible for public assistance, under new proposals to simplify the state’s welfare system.
The proposed changes being considered at the State Capitol would eliminate the requirement that people on Minnesota’s family welfare program submit a complicated and lengthy form every month to prove eligibility. And, for the first time, monthly payments for the Minnesota Family Investment Program (MFIP) would be adjusted annually to reflect the rising costs of food, rent and other essentials.
These proposals come against a background of welfare spending in Minnesota that is already some of the highest in the United States.
As we noted in our report ‘Closing Minnesota’s Budget Deficit Why we should make spending cuts and not raise taxes,’ welfare spending – which includes monies spent on assistance programs targeted toward low-income individuals and spending on Medicare and Medicaid – is the second biggest category in the state’s budget, accounting for more than 30% of General Fund spending in each year between 2010 and 2018.
As Figure 1 shows, we explained that:
In 2018, Minnesota’s state government spent $30,479 in public welfare for each person in poverty. This compares to a national average of $17,127 and ranks our state third nationally for welfare spending, as Figure 7 shows. Only Massachusetts and Alaska spent more in welfare per person in poverty than Minnesota in 2018.
Indeed, Minnesota’s welfare spending is so high compared to other states that if its state government spent the national average per person in poverty—$17,127—it would have spent only $9.0 billion in 2018, which is $7.1 billion less than the $16.1 billion it actually spent.
Figure 1: Welfare spending per person in poverty, 2018 USD
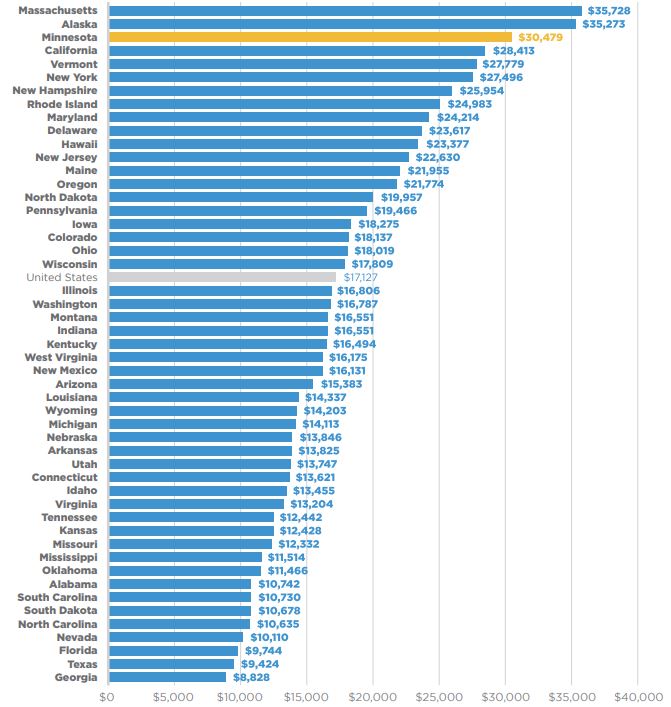
Source: Census Bureau
To see how this has changed over time, in our new report ‘The State of Minnesota’s Economy: 2020‘ we look at Personal Income data for ‘Personal current transfer receipts’ (transfer income), which:
“Consists of income payments to persons for which no current services are performed and net insurance settlements. It is the sum of government social benefits and net current transfer receipts from business”
As Figure 2 shows, this rose by 82% in Minnesota from 2000 to 2019. This was above the
growth for the United States generally — 66% — and ranked our state ninth out of the
50 states and the District of Columbia.
Figure 2: Real per capita transfer income growth, 2000 to 2019
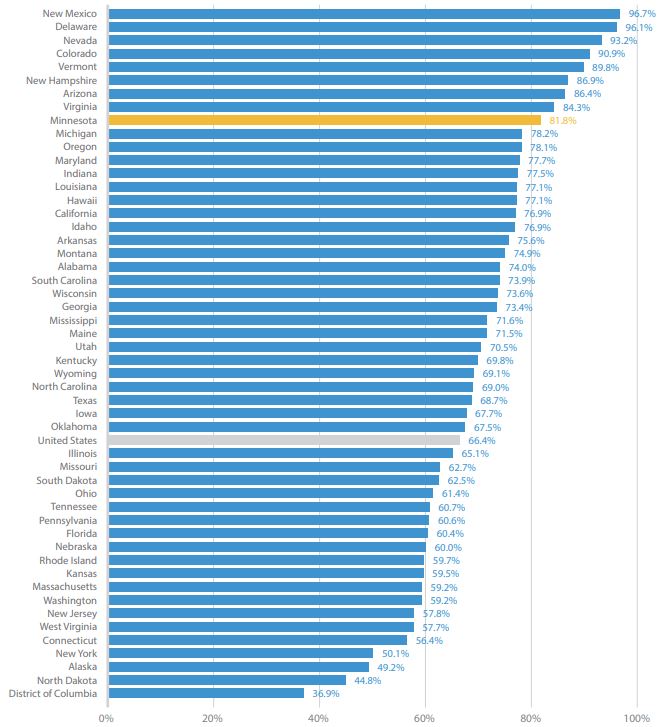
Source: Bureau of Economic Analysis
Increases in welfare spending are often touted as solutions to Minnesota’s racial disparities, which are some of the widest in the United States. But these disparities have come about when Minnesota has been spending record amounts on welfare: the idea that more welfare spending will reduce racial disparities would seem to have been tested to destruction. Rather than pushing harder on the policies in which the situation has arisen, let us look for an approach which actually works.
John Phelan is an economist at the Center of the American Experiment.