Minnesota’s per capita Personal Income growth is lagging the national rate
I’ve struck a pessimistic note about Minnesota’s economy this week. I’ve noted that Minnesota’s economy — even in per capita terms — has grown more slowly than the United States’ economy generally in every year since 2014 and that the median household income in Minnesota grew more slowly than nationally in six of the seven years since 2014. We have shifted to a lower growth path in the last decade.
In part, I was inspired to write these articles by an op-ed that ran in the Star Tribune last weekend titled “You doubt Minnesota’s economy? I’ll take the other side of that bet.” It was a good example of how a set of cherry-picked stats in the hands of someone who doesn’t fully understand how to use them can mislead.
“To start,” the op-ed noted,
…Minnesota has a long track record as the Midwest’s strongest economy. Over the last 50 years, the state recorded the highest personal income growth in the region and the third-highest GDP growth, topped only by North and South Dakota — two smaller states with high exports that are not useful comparisons.
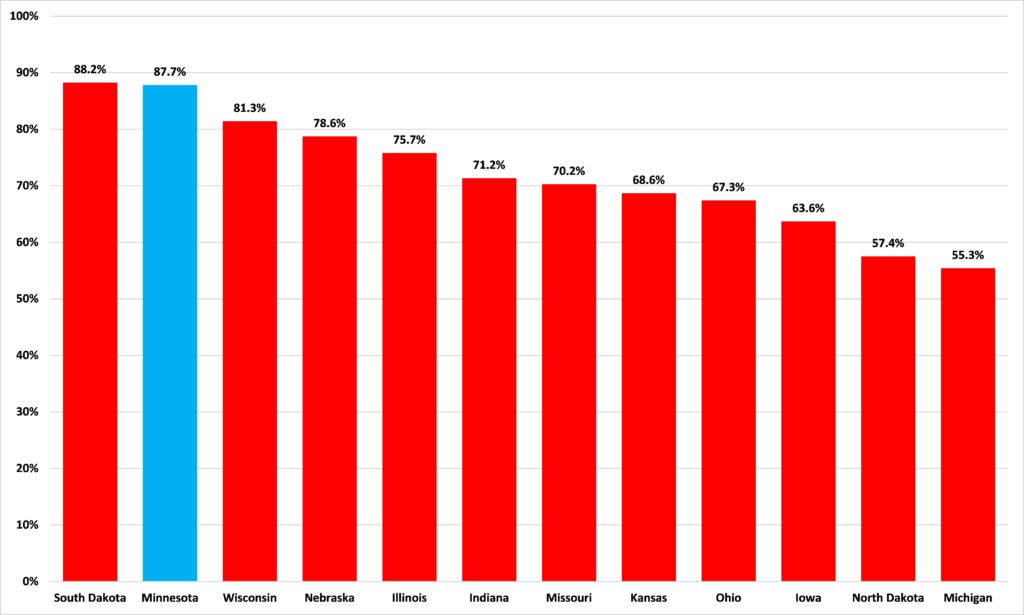
This is just incorrect. Data from the Bureau of Economic Analysis show that, adjusted for inflation using the Consumer Price Index, between 1973 and 2022, Personal Income per capita actually grew slightly more rapidly in South Dakota than in Minnesota, as Figure 1 shows. You may argue that I am being unfair, that the author said nothing about adjusting for inflation or population; well, if he didn’t, he should have.
Figure 1: Real per capital Personal Income growth in Midwestern states, 1973 to 2022
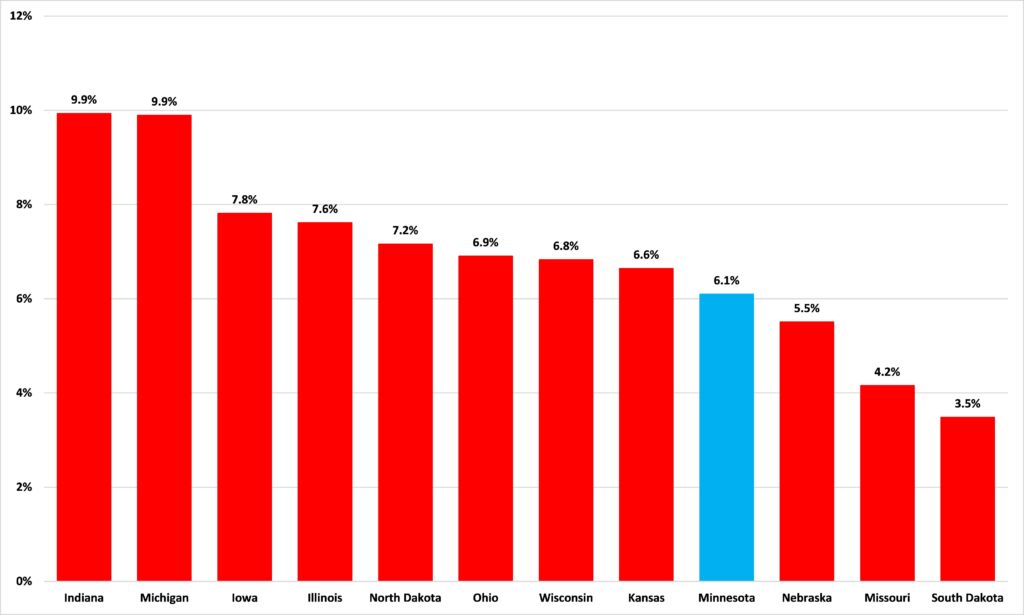
The point about exports isn’t true, either. Census Bureau data show that, in fact, in 2022, South Dakota’s exports amounted to 3.5% of state GDP and that for Minnesota the figure was 6.1%, as Figure 2 shows. North Dakota’s exports, at 7.2% of state GDP, were only 1.1 percentage points above Minnesota’s. Michigan, which the author does use as a comparison, had a share of exports to GDP 3.8 percentage points higher than Minnesota. I have written at length about why state to state comparisons, specifically in the case of Minnesota and its neighbors, often obscure as much as they reveal, but their exports are not one of those reasons.
Figure 2: Exports as a share of GDP, 2022
These are not big errors, perhaps, but errors they are. When free marketeers have submitted op-eds to the Strib recently, they have been required to provide spreadsheets backing up each of their points.
Moving on from the op-ed’s simple errors of fact, we can also ask why we are only comparing Minnesota’s performance to its neighbors. We are not only in competition with them. When we look at the states Minnesotans are fleeing to, IRS data show that the five most popular destinations are Colorado, Washington, Texas, Arizona, and Florida. The truth is that a comparison of Minnesota’s economy with that of Florida would be very damming indeed for our state.
We can also ask why we are looking at such a long span of time, half a century. Nobody denies that the Minnesotans of the past bequeathed a great place to live, the question is what is happening to it now. That is why I have looked at more recent years and found those depressing trends.
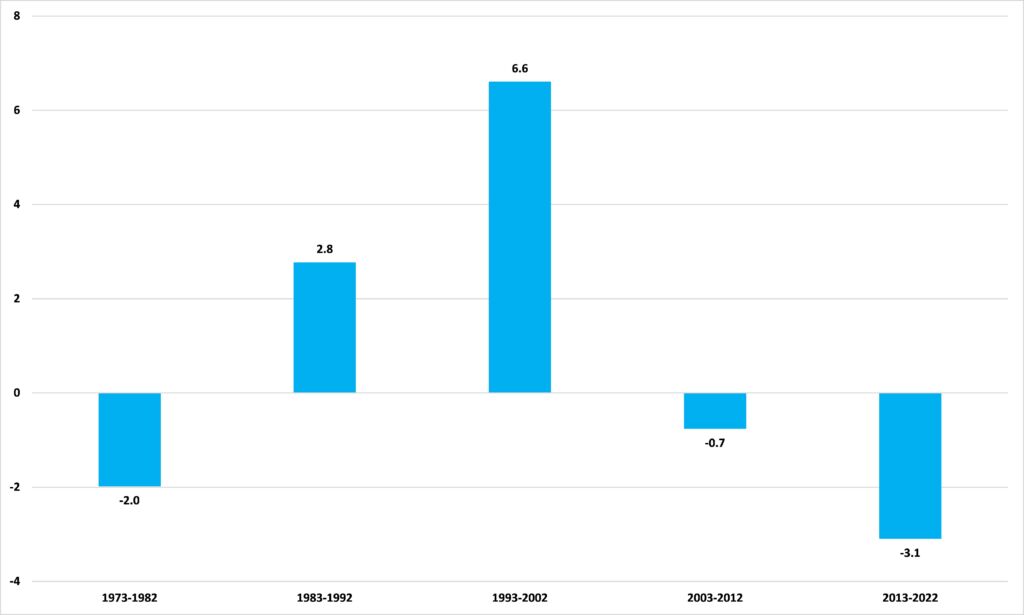
And if we break that real, per capita Personal Income data into smaller periods, we find similar trends. Figure 3 shows the percentage point difference in the change in real, per capita Personal Income of Minnesota and the United States for five subperiods. Between 1993 and 2002, for example, per capita Personal Income grew in real terms by 17.7% in the United States and by 24.3% in Minnesota, meaning a 6.6 percentage point gap in Minnesota’s favor. Since then, however, real terms per capita Personal Income has grown more rapidly in the United States than in Minnesota and in the period 2013-2022, the rate of real terms, per capita Personal Income growth was 3.1 percentage points lower for Minnesota than for the United States, the worst performance by our state in any of our sub-periods.
Figure 3: Difference in real, per capita Personal Income growth rates, Minnesota and United States, percentage points
To repeat, this state is a great place to live, and the trick is to keep it that way. That means we must look at the data as it is, not as we would wish it to be, and be willing to confront the fact that, in recent years, our economy has underperformed. It is all well and good to talk about economic changes over five decades, but, as Janet Jackson famously asked, what have you done for me lately?