The ‘Delta variant’ surge in Minnesota
‘As delta variant causes surge in cases, officials closely watching new mutation.’ So KSTP reported at the weekend. ‘Minnesota Officials Urge Shots as Delta Variant Surges,’ U.S. News reported. “‘I’m Scared For My Patients’: As COVID Cases, Surge, Delta Plus Variant Worries Medical Experts,” ran one WCCO report.
Indeed, cases of COVID-19 are ‘surging’ in Minnesota. Minnesota Department of Health numbers (Figure 1) shows that the seven-day average for new cases has risen from a low of 87 for the seven days up to and including June 27 to 557 for the seven days up to and including July 29*.
Neither is this just a result of increased testing. The ratio of positive tests to all tests conducted (the positivity rate) has risen from a low of 0.8 percent in the seven days up to and including June 29 to 4.1 percent for those up to and including July 29. Fueled by the new ‘Delta variant”, COVID-19 has been surging again in Minnesota for a month.
Figure 1: New cases of COVID-19 in Minnesota and positivity rate, seven-day moving average
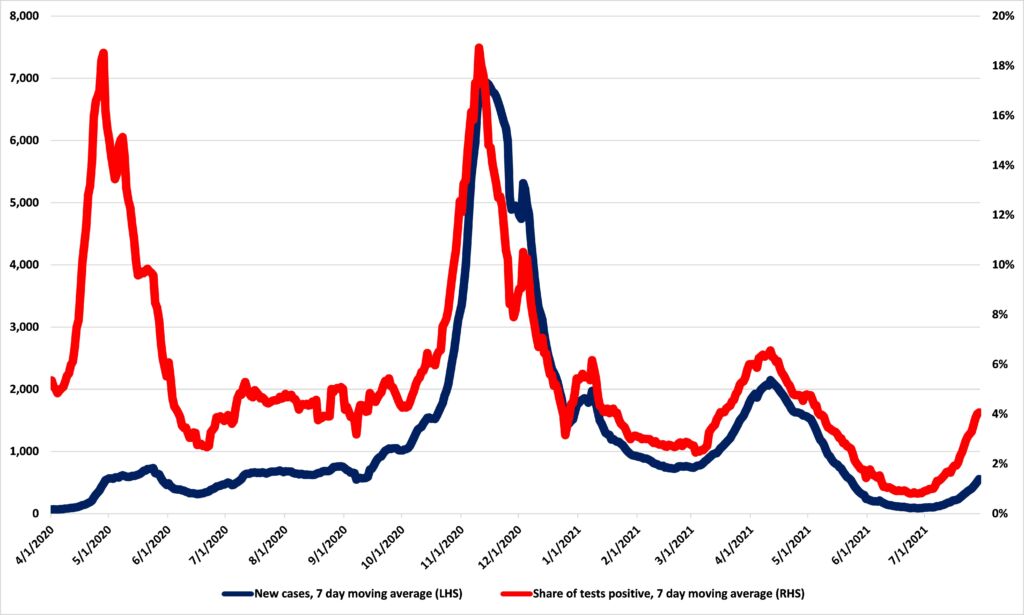
Source: Department of Health
Cases lead to hospitalizations, as Figure 2 shows. In terms of new cases, the surge last November peaked in the seven days up to and including November 13, Non-ICU hospitalizations peaked 12 days after that (November 25), and ICU hospitalizations peaked seven/eight days after that (December 1/2). In April’s surge, cases peaked in the seven days up to and including April 11, Non-ICU hospitalizations peaked seven days after that (April 18), and ICU hospitalizations peaked six/seven days after that (April 24/25).
So far in this surge, Non-ICU COVID-19 hospitalizations have risen from 74 in the seven days up to and including July 3 to 134 in the seven days up to and including July 29, and ICU hospitalizations have increased from 21 on July 17/18 to 50 on July 29.
Figure 2: New cases of COVID-19 in Minnesota and hospitalizations, seven-day moving average
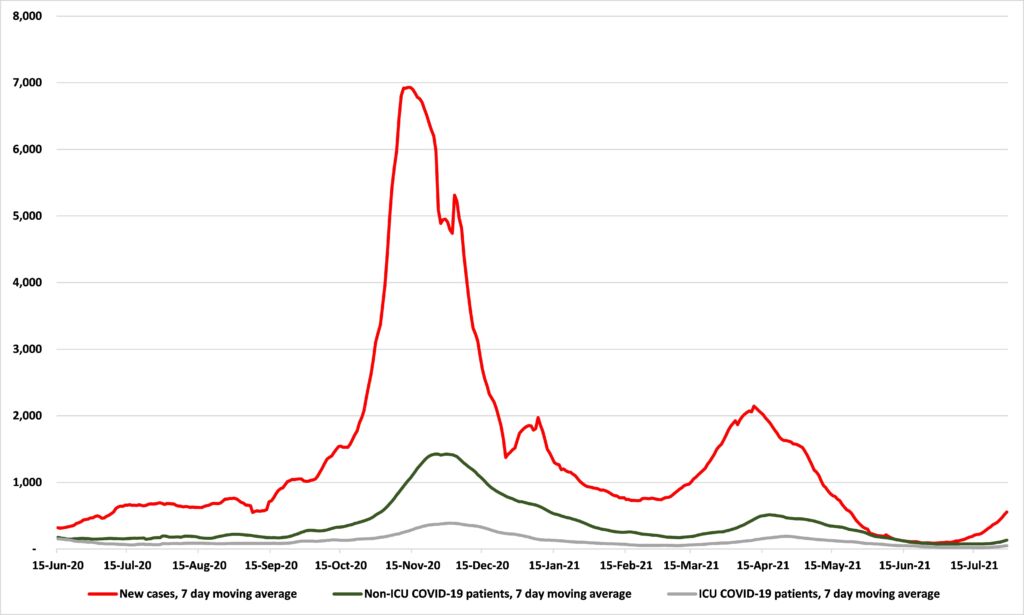
Source: Department of Health
Deaths, in turn, lag hospitalizations, but not by as much. As Figure 3 shows, in the November surge when ICU hospitalizations peaked in the seven days up to and including December 2, deaths peaked 5/6 days later in the seven days up to and including December 7/8 and in April, when ICU hospitalizations peaked in the seven days up to and including April 25, deaths peaked just 4 days later, on April 29.
It is striking to note, however, that COVID-19 appears to have become much less deadly over time. While Figure 3 shows quite a definite bump in deaths for the November surge, there is almost no surge in deaths associated with the surge in cases and hospitalizations in April.
Figure 3: New cases of COVID-19 in Minnesota, ICU hospitalizations, and deaths, seven day moving average
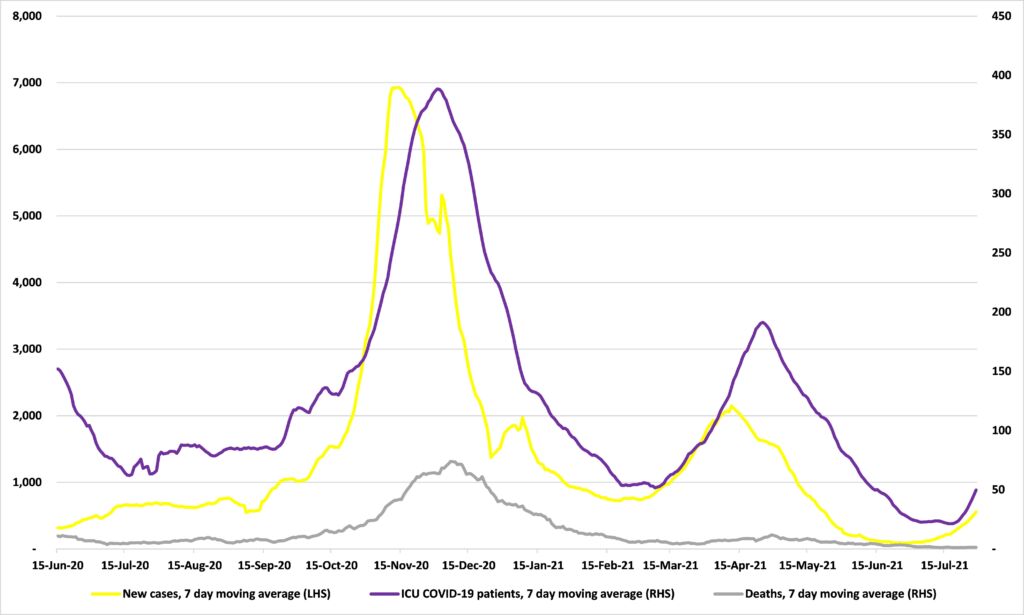
Source: Department of Health
To see this more clearly, Figure 4 shows the Case Fatality Rate (CFR) — the share of cases which resulted in death (cumulative deaths / cumulative cases) — for COVID-19 in Minnesota. The CFR surged to a peak of 6.4 percent in April last year, probably as a result of lower testing volumes concentrating tests on likely cases and, thus, being more likely to find cases. Since then, however, the CFR of COVID-19 has plummeted to 1.3 percent for the seven days up to and including July 29. Indeed, during the November 2020 surge in cases (September 7 to November 13), the CFR was 1.9 percent. For the April 2021 surge (March 2 to April 11) the CFR was 1.4 percent. So far, in this surge (since June 27), the CFR has held at 1.3 percent.
And these are only the infections we know about. A share of COVID-19 infections are asymptomatic, i.e., the victim never knows they have it. It is unclear, then, what the Infection Fatality Rate (IFR) is which is the true measure of the deadliness of the virus, but it is certain to be lower than the CFR.
Figure 4: Case Fatality Rate for COVID-19 in Minnesota
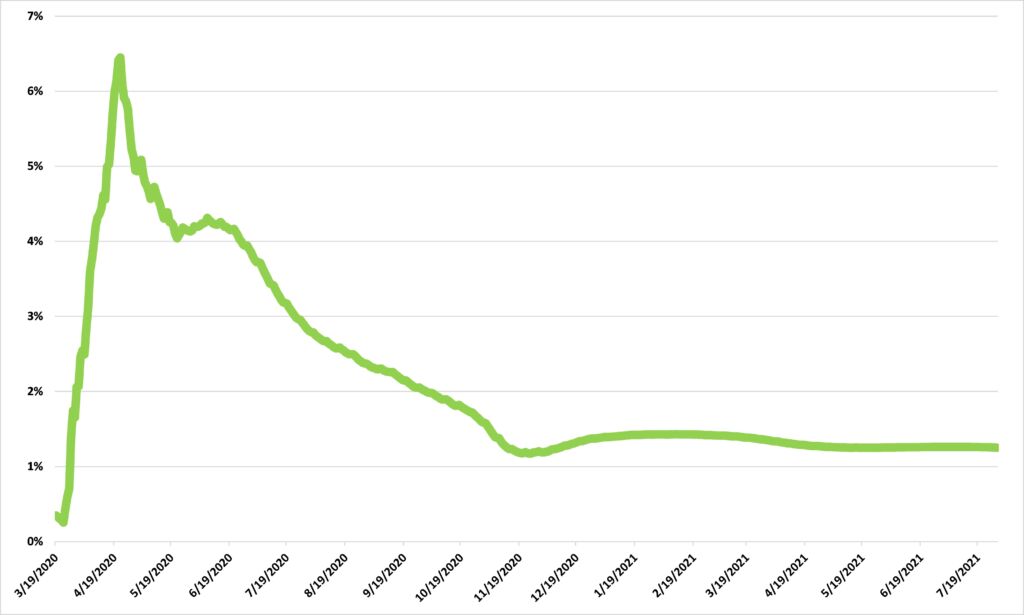
Source; Department of Health
So, what might Minnesota be in for? Tomorrow I’ll take a look at the recent surge of the ‘Delta variant’ in Britain and see what that might tell us.
*The most recent date for which numbers are more or less reliable.