U.S. employment growth has stalled since March
Earlier this month, CNBC reported:
Hiring in July was far better than expected, defying multiple other signs that the economic recovery is losing steam, the Bureau of Labor Statistics reported Friday.
Nonfarm payrolls rose 528,000 for the month and the unemployment rate was 3.5%, easily topping the Dow Jones estimates of 258,000 and 3.6%, respectively. The unemployment rate is now back to its pre-pandemic level and tied for the lowest since 1969, though the rate for Blacks rose 0.2 percentage point to 6%.
Coming after the news that the American economy had contracted for the first two quarters of this year, this news prompted some extravagant – not to say witless – reactions:
Real incomes are, of course, down, so many hard pressed Americans would quibble with the notion they were just facing a “vibecession.”
Still, we have a puzzle: a shrinking economy and falling incomes coexisting with an apparently strong labor market. The Financial Times reported recently:
“We’re all scratching our heads a little bit,” admits Martine Ferland, chief executive of Mercer, which advises companies on workforce and benefits issues.
“I’ve been in this industry for 25 years and I’ve never seen anything like it,” echoed Joanie Bily, chief workforce analyst at EmployBridge, which places workers in manufacturing, logistics and call centre jobs. “Even if we’re in a technical recession, this is a really different type of recession because the labour market still remains strong.”
That blockbuster number of 528,000 jobs added nationwide in July comes from the Establishment survey. As Business Insider explained in 2014:
…data for the Establishment is collected by the U.S. Bureau of Labor Statistics as part of its Current Employment Statistics (CES) survey, which incorporates the payroll records of some 144,000 non-farm establishments and government agencies, covering workers at some 554,000 individual worksites. In addition to determining the number of people employed at the surveyed locations as of the payroll period including the 12th of each month, the BLS collects data on the number of hours worked, earnings and the industries in which individuals are employed at the surveyed organizations.
But when the the U.S. Bureau of Labor Statistics (BLS) puts out its Employment Situation report each month, it provides another estimate of employment from the Household survey. This:
…is conducted by the U.S. Census Bureau, which surveys some 60,000 American households during the week of the 12th of each month as part of its Current Population Survey (CPS). In addition to determining the employment status of the individuals in each surveyed household, which it classifies as employed, unemployed or not in the civilian labor force, the Census collects data on their demographic profiles, including race, Hispanic origin, age, sex, et cetera.
The BLS explains:
The numerous conceptual and methodological differences between the household and establishment surveys result in important distinctions in the employment estimates derived from the surveys. Among these are:
– The household survey includes agricultural workers, self-employed workers whose businesses are unincorporated, unpaid family workers, and private household workers among the employed. These groups are excluded from the establishment survey.
– The household survey includes people on unpaid leave among the employed. The establishment survey does not.
– The household survey is limited to workers 16 years of age and older. The establishment survey is not limited by age.
– The household survey has no duplication of individuals, because individuals are counted only once, even if they hold more than one job. In the establishment survey, employees working at more than one job and thus appearing on more than one payroll are counted separately for each appearance.
On points 1 and 4 the Household survey would seem to be a better measure. On points 2 and 3 the Establishment survey would seem to have the edge. Crudely put, the Establishment survey measures jobs while the Household survey measures people.
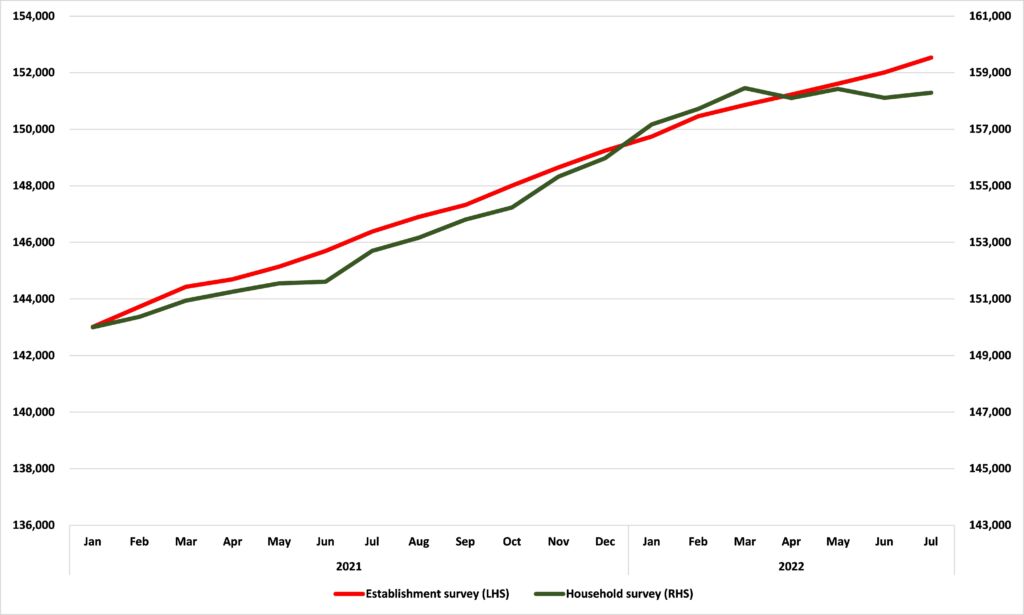
So what did the Household survey say about employment in July? In contrast to the blockbuster gain of 528,000 jobs estimated by the Establishment survey, it gave a figure for just 117,000 newly employed people. Indeed, it registered big losses in the number of people employed in both April and June so that the number of people employed in the American economy is only up by 568,000 since February. Indeed, as Figure 1 shows, there has been hardly any growth in the number of people employed at all since March.
Figure 1: Employment, Establishment survey and Household survey, thousands
How do we square these two numbers?
Recall that Business Insider explained that:
The household survey has no duplication of individuals, because individuals are counted only once, even if they hold more than one job. In the establishment survey, employees working at more than one job and thus appearing on more than one payroll are counted separately for each appearance
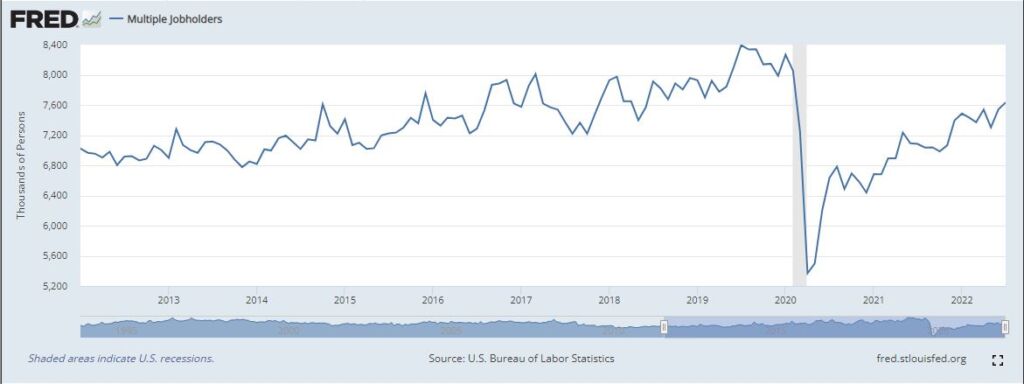
So, someone who has, say, two jobs will show up on the Household survey as one person but on the Establishment survey as two jobs. And, as Figure 2 shows, data from the Household survey show that the number of multiple jobholders hit its highest level in July since February 2020.
Figure 2
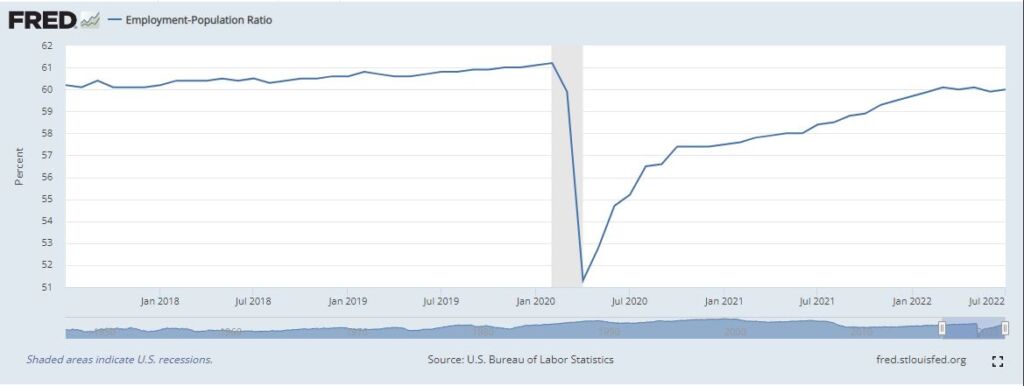
The story of American employment in recent months is not, then, one of a massive increase in the number of people employed. As Figure 3 shows, despite the ‘blockbuster’ jobs numbers given by the Establishment survey, the share of the population actually employed, measured by the Household survey, was lower in July than it was in March.
Figure 3
The story of the American labor market at present is, in fact, one of people with falling incomes taking multiple jobs to stay afloat. Try telling them this is just a “vibecession.”