Why inflation came in ‘hot’ again and why that’s a problem for the federal government
The Bureau of Labor Statistics (BLS) announced today that the Consumer Price Index (CPI) increased — the rate of inflation — by 0.4% in March, which matches February’s number for another “hot” reading.
What is causing “hot” inflation?
I have argued that our current inflation results from a frenzied bout of money printing intended to keep the cost of government borrowing down during the COVID-19 pandemic. As this money printing stopped and, indeed, went into reverse, I was optimistic that inflation would fall back to the Federal Reserve’s 2% target reasonably quickly. But, as I noted last month, the money supply did not keep shrinking. Indeed, it has been more or less flat now since April last year. In the last quarter of 2023, the money supply on the M2 measure was 33.0% above its level of Q1 2020 while real GDP — the “stuff” available for that money to be spent on — increased by just 9.7% over the same period. Simply put, with relatively more money chasing relatively fewer goods, the prices of those goods get bid up and you have inflation.
Why did the money supply stop shrinking? I’ve previously noted the relationship between between the “broad” measure of the money supply, M2, changes in the rate of growth of which are linked to changes in the rate of inflation, and the “narrow” measure of the “Monetary Base.” This latter is directly controlled by the Federal Reserve and is composed of “Currency in Circulation” — notes and coins — and Reserve Balances, the money that depository institutions maintain in their accounts at their regional Federal Reserve banks.
Figure 1 shows how these components have changed over time. From 1959, Reserve Balances drifted down from an average of 36.9% of the Monetary Base to 2.4% in the twelve months prior to October 2008. Then the Federal Reserve initiated its program of Quantitative Easing” (QE), which involved creating new money and using it to buy assets from the financial sector, swelling the Reserve Balances: In the twelve months beginning October 2008, Reserve Balances jumped to 44.5% of the Monetary Base.
Figure 1: Composition of Monetary Base
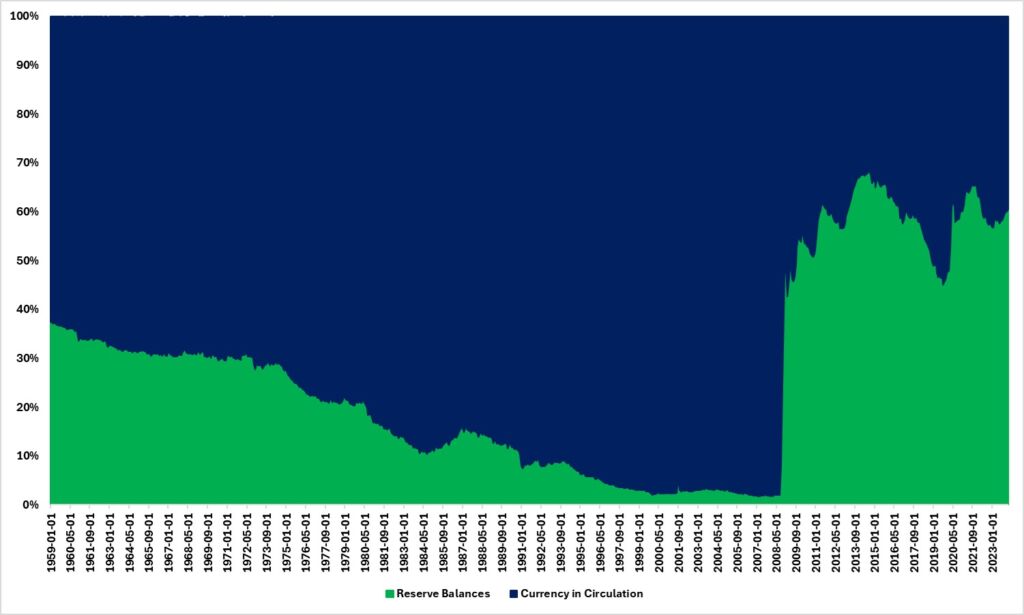
Source: Board of Governors of the Federal Reserve System
Figure 2 makes the point clearly. Since September 2008, the expansion of Reserve Balances has accounted for 70.0% of the total expansion of the Monetary Base: Since January 2020, the figure is 78.2%. This is the result of the Federal Reserve buying assets, largely Treasury bills, with newly created money.
Figure 2: Reserve Balance and Currency in Circulation, $ millions
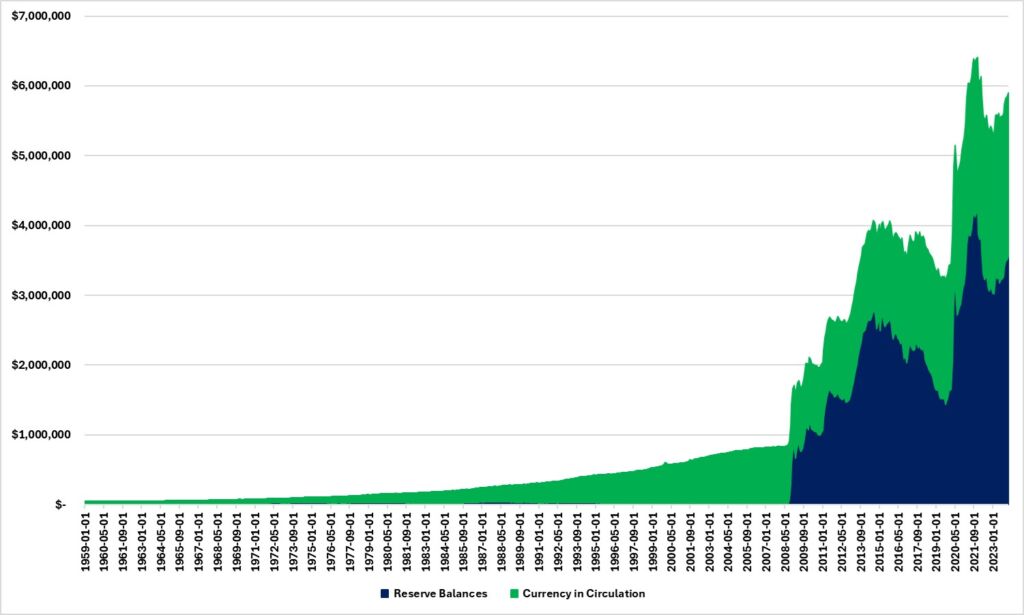
Source: Board of Governors of the Federal Reserve System
The far right hand side of both Figure 1 and Figure 2 also tell us a similar story to the one we see in the figures for M2. From a peak in December 2021, the Monetary Base began shrinking as the Federal Reserve unloaded assets, either by selling them or letting them mature (M2 peaked in March 2022). Then, in October 2022, the Federal Reserve stopped this “Quantitative Tightening” and its balance sheet stopped shrinking (as noted above, M2 stopped shrinking in April 2023).
Why this is a problem for the Feds
The price of Treasury bills works the same way as the prices of anything else. As the Federal Reserve stops buying them from financial institutions demand for them falls and so does their price. This is important because the price of a Treasury and its yield move in opposite directions, and the yield is the interest rate.
Here is an example: Imagine you’re the German government and you want to borrow money. You sell a certificate to someone promising to pay them, say, $100 30 years from now. The buyer will not, usually, hand you $100 in return for this certificate. Why would they? They could just keep their $100. You have to offer them an incentive to buy so you sell them the certificate for, say, $95. They give you $95 now — the price — in return $100 30 years from now. The yield, or interest, is $5.
Now imagine that you’re the government of Greece and you want to borrow money. You offer to sell a certificate promising to pay, say, $100 30 years from now, but nobody will touch you with a bargepole. You have to cut the price of the certificate. You won’t get $95 like the Germans, but maybe you’ll get $50. But, as you see, as the price falls the yield rises, and vice versa. You also see that to raise the same amount of money as the German government, the Greeks have to issue a lot more debt.
In the event that the price of debt instruments like Treasuries fall and their yields rise, the government might be grateful if the central bank — which is the fabled “Magic Money Tree” — stepped in to buy them at the preferred, higher price and lower yield. This practice, known as “monetization,” is generally frowned upon as inflationary: Indeed, the Federal Reserve is precluded from buying Treasuries directly from the Treasury. But it can buy them indirectly from financial institutions. Given that Treasuries in the primary and secondary markets are near perfect substitutes, this generally suffices.
Which brings us back to the Federal Reserve in the autumn of 2022. As they sought to reduce their holdings of Treasuries, the demand for them fell and so did the price: And the yield went up. The yield on the 10 year Treasury rose from 0.56% in August 2020 to 4.2% on October 23, 2022. The cost of federal government borrowing began to skyrocket. As Figure 3 shows, interest payments on federal government debt rose from 2.3% of GDP in Q3 2020 to 2.9% in Q3 2022. The figure now stands at 3.7%, the highest this century.
Figure 3: Federal government interest payments as a share of GDP
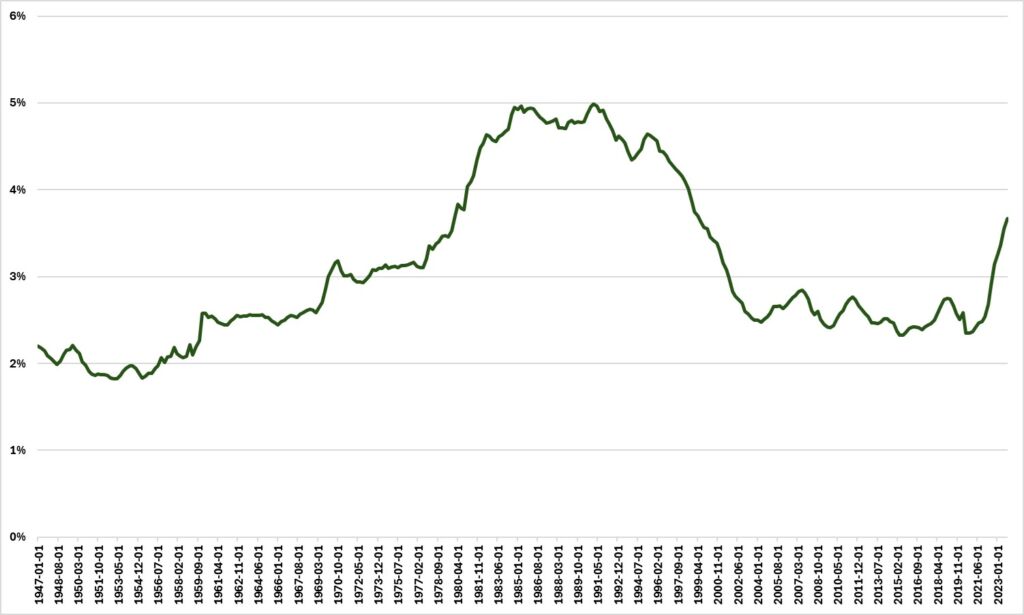
Source: Bureau of Economic Analysis
The last time the interest payments on federal government debt were this high, the federal budget was on its way to a surplus of 2.3% of GDP in 2000. That is not the case now. As Figure 4 shows, the Biden administration is currently running budget deficits of a magnitude usually only seen in recessions. Indeed, one reason the economy might have dodged recession despite the Federal Reserve’s monetary tightening is because of this fiscal stimulus.
Figure 4: Federal budget surplus or deficit as a share of GDP
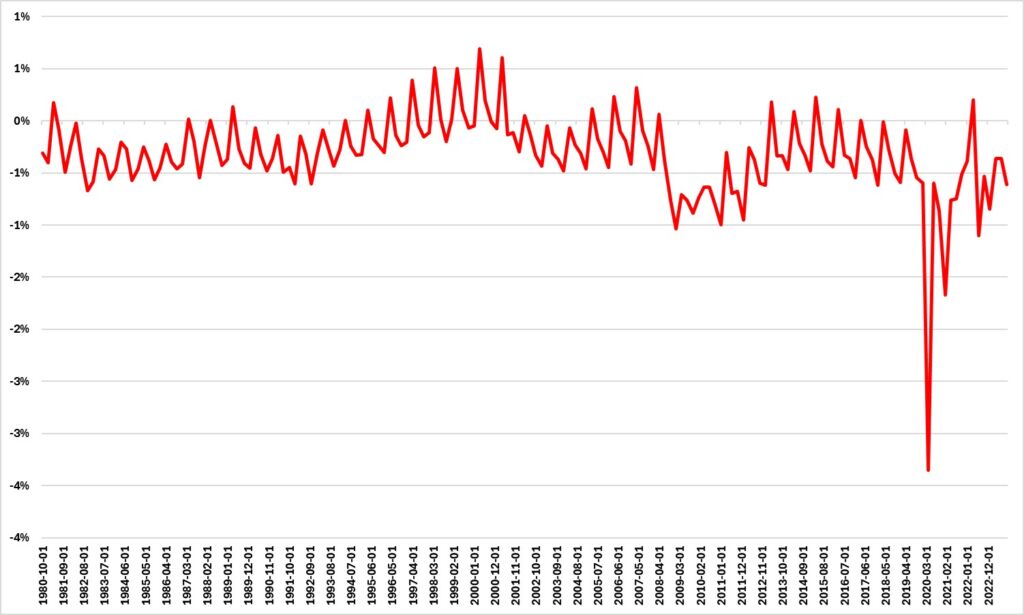
Source: Bureau of Economic Analysis and Department of the Treasury
And this is only forecast to get worse. In February, the Congressional Budget Office released its latest Budget and Economic Outlook, providing 11‐year fiscal projections for 2024 to 2034. In it:
…federal budget deficits total $20 trillion over the 2025–2034 period and federal debt held by the public reaches 116 percent of GDP. Economic growth slows to 1.5 percent in 2024 and then continues at a moderate pace.
So the Federal Reserve finds itself in a tricky position. To reduce the rate of inflation it needs to raise the Fed funds rate or resume shrinking the Monetary Base (which reducing the funds rate does indirectly). But this risks increasing the federal government’s borrowing costs at a time when they are already spiraling out of control. Many commentators have marveled at the “soft landing” the Fed has engineered thus far, reducing inflation without causing unemployment to spike. Things might yet get bumpy.