U.S. has added 2.5 million new jobs since March, but only 1.2 million more Americans are employed
Last week’s jobs report estimated that Nonfarm payrolls increased 263,000 for the month, compared with the Dow Jones estimate of 275,000. This prompted the usual round of celebrations from people who ought to know better.
As I’ve explained previously, these numbers come from the Establishment survey which the U.S. Bureau of Labor Statistics collects as part of its Current Employment Statistics (CES) survey. It tells you how many new jobs have been added.
But while the number of jobs increased by 263,000, the number of Americans employed increased by just 204,000. These numbers come from the Household survey which is conducted by the U.S. Census Bureau as part of its Current Population Survey (CPS).
Indeed, this was the seventh month out of nine this year where the number of jobs has seen a greater increase than the number of people employed. Since March, the number of jobs has grown by 2.6 million but the number of people employed by just 1.2 million.
How do we square these two numbers? Someone who has two jobs will show up on the Household survey as one person but on the Establishment survey as two jobs. And, as Figure 2 shows, data from the Household survey show that the share of all employees who are multiple jobholders is at its highest level since February 2020.
Figure 2
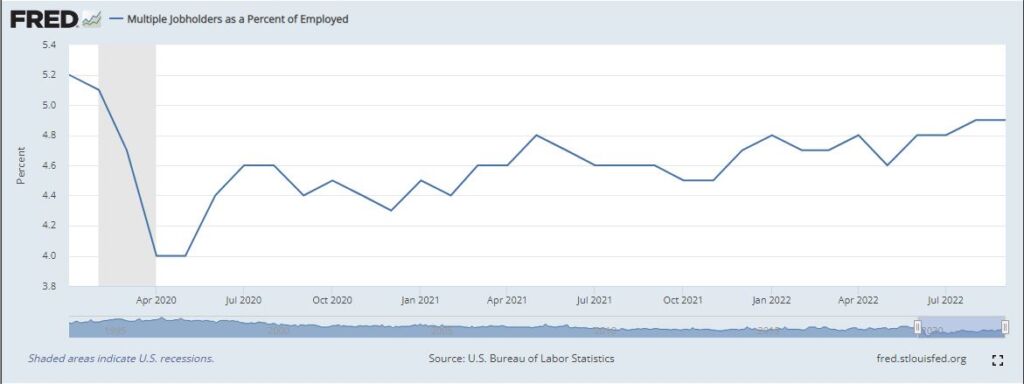
That explains why Labor Force Participation rate growth is so sluggish at the same time as we are racking up ‘bumper’ months for job growth. The story of the American labor market at present is, in fact, one of people with falling incomes taking multiple jobs to stay afloat.