What is driving above-average inflation in the Midwest?
The rate of year-over-year inflation in the United States hit a 40 year high in February. The rate of increase was higher in the Midwest than it was for the United States generally. What is driving this?
Data from the Bureau of Labor Statistics allows us to dig into this a little. Besides compiling a Consumer Price Index (CPI) for the United States, it also does so for the Midwest and West North Central divisions — both of which contain Minnesota — and the seven-county Minneapolis-St. Paul-Bloomington Metropolitan Statistical Area, albeit with fewer data. If we compare February’s year-over-year price increases in these areas with the increases for the United States generally, we can identify which price increases are driving the above-average rates of inflation we have here.
Figure 1 shows the percentage point difference between the year-over-year inflation rate for the United States and that for the West North Central division (which includes Iowa, Kansas, Minnesota, Missouri, Nebraska, North Dakota, and South Dakota) for all categories where the difference is greater than one percentage point. Where the number is 1.0 and above (the red bars), inflation in the West North Central division was above the national rate, and where the number is -1.0 or less (the green bars), it was lower.
Figure 1: Percentage point difference in year on year CPI increase, United States and West North Central division
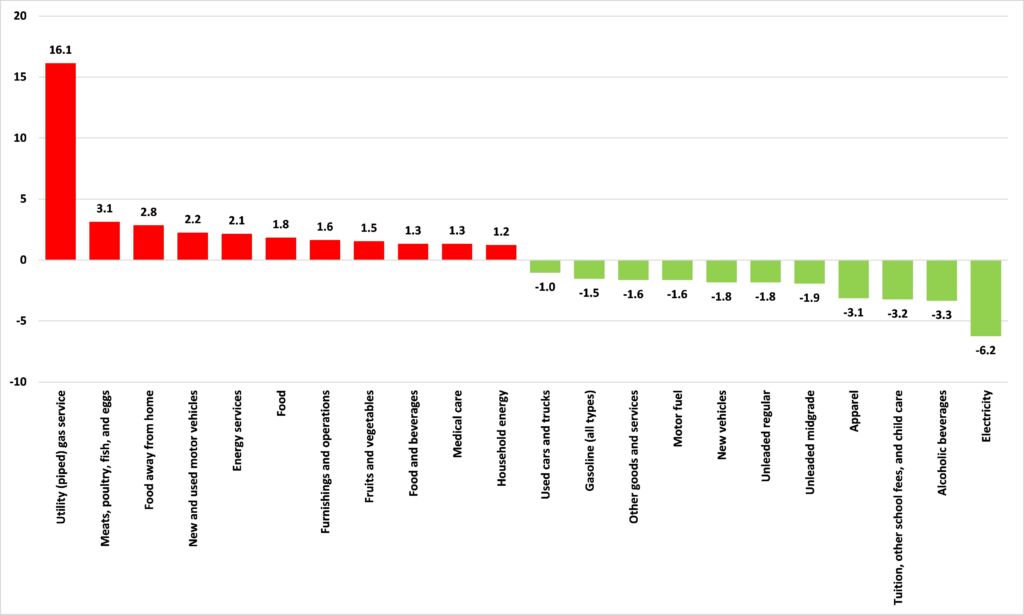
We see that the majority of the bars on the left-hand side of the chart, where the West North Central division has seen a higher rate of inflation than the United States, are concentrated in Food and beverages (5 out of 11) or the Fuels and utility components of Housing (3 out of 11). These categories are what contributed most to national inflation over the last year but remember, this chart shows you how much more than that this inflation has been here in the West North Central division. The United States generally is getting hit hard with price increases in these categories, but we are getting it worse.
Looking at the right-hand side of the chart, we see that most of the categories where inflation in the West North Central division has lagged that of the United States generally are clustered in the Private Transportation category (6 out of 11 categories). Driving has gotten more expensive here over the last year, but by less than elsewhere in the country.
The BLS data also allows us to look at inflation in the Twin Cities. Figure 2, like Figure 1, shows the percentage point difference between the year-over-year inflation rate for the United States and that for the seven-county Minneapolis-St. Paul-Bloomington Metropolitan Statistical Area for all categories where the difference is greater than one percentage point.
Figure 2: Percentage point difference in year-on-year CPI increase, United States and Minneapolis-St. Paul-Bloomington MSA

In contrast to the figures for the region generally, for the Twin Cities, the majority of the bars on the left-hand side of the chart are from the Private transportation category: while the price of driving has risen more slowly than the national rate for the region, for the Twin Cities it has risen more quickly.
What jumps out from both charts, however, is how the price of Utility (piped) gas — which refers to natural gas — has risen so much more in this region and in the Twin Cities than it has nationally. It has been a big contributor to our above-average rate of inflation and figuring out what is causing that is an important task. Watch this space.
Learn more about how liberal policies make energy expensive and unreliable 👇

Gas prices and energy bills are going through the roof! 😰
But it doesn’t have to be this way…liberal policies are making energy expensive and unreliable.
Join American Experiment policy fellows Isaac Orr and John Phelan for a webinar this Thursday, March 17th at 11 AM CST for some common sense things we can do to keep energy affordable for everyone.