Your guide to Lazard’s LCOE analysis Part 4: Lazard says wind and solar costs are increasing
Wind and solar advocates frequently misquote Lazard’s Levelized Cost of Energy (LCOE) analysis to make two incorrect statements. The first incorrect claim is that wind and solar facilities generate electricity at a lower cost than coal, nuclear, and natural gas power plants.
The second erroneous claim by renewable proponents is that wind and solar prices have dropped dramatically since 2009, and they will continue to do so in the future. Lazard’s data does indeed show a significant drop in the price of both wind and solar since 2009, but their most recent report shows wind and solar costs increased substantially from 2021 to 2023.
This article is Part 4 of our series on the Lazard LCOE analysis. You can click here to access the table of contents for these articles.
Going up?
The graph below uses the “Selected Historical Mean Unsubsidized LCOE Values” of wind and solar on page 9 of the Lazard analysis. As you can see, there was a large decline in the cost of both wind and solar from 2009 through about 2015, after which time the cost declines for these technologies was much more modest.
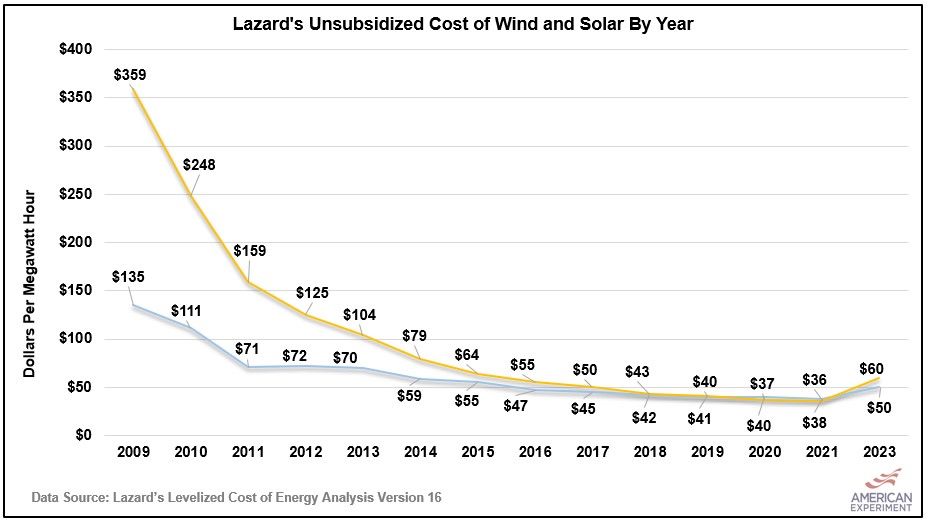
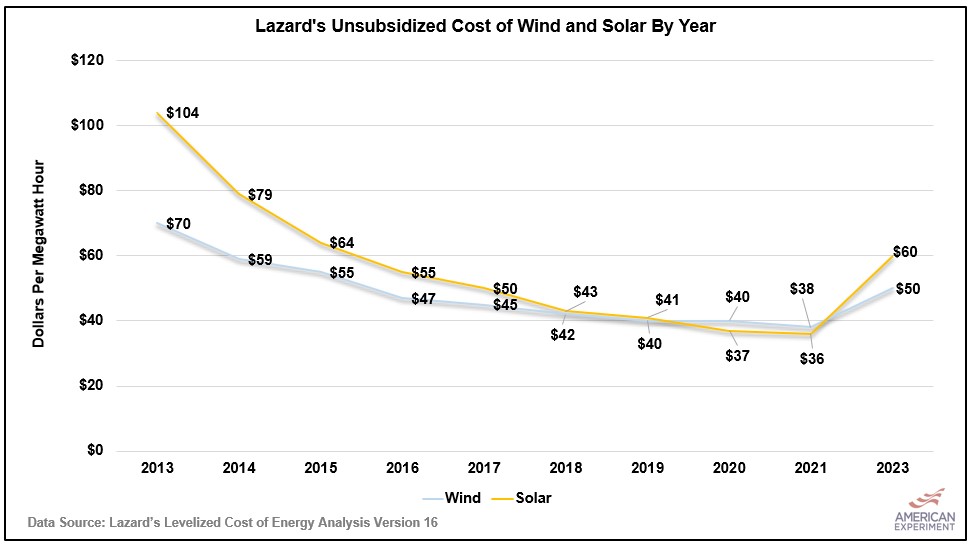
Zooming in on the last ten years of data helps illustrate how drastic the price increases for wind and solar were. In 2021, solar prices were about $36 per MWh, but in 2023, they had nearly doubled to $60 per MWh. Wind prices increased from $38 per MWh to $50 per MWh during this period.
The question moving forward is whether the price of wind and solar will go up, down, or remain elevated relative to 2016 prices. Examining why prices are rising can help us make informed estimates about where these costs might go in the future.
Why are prices rising?
Wind and solar prices are rising due to a wide variety of factors, including higher material costs for wind turbine and solar panel components, supply chain disruptions from the COVID-19 pandemic, and federal tariffs in response to China’s “dumping” of subsidized solar panels into the U.S. market and import restrictions on Chinese solar module imports that were made with enslaved Muslim Uygurs.
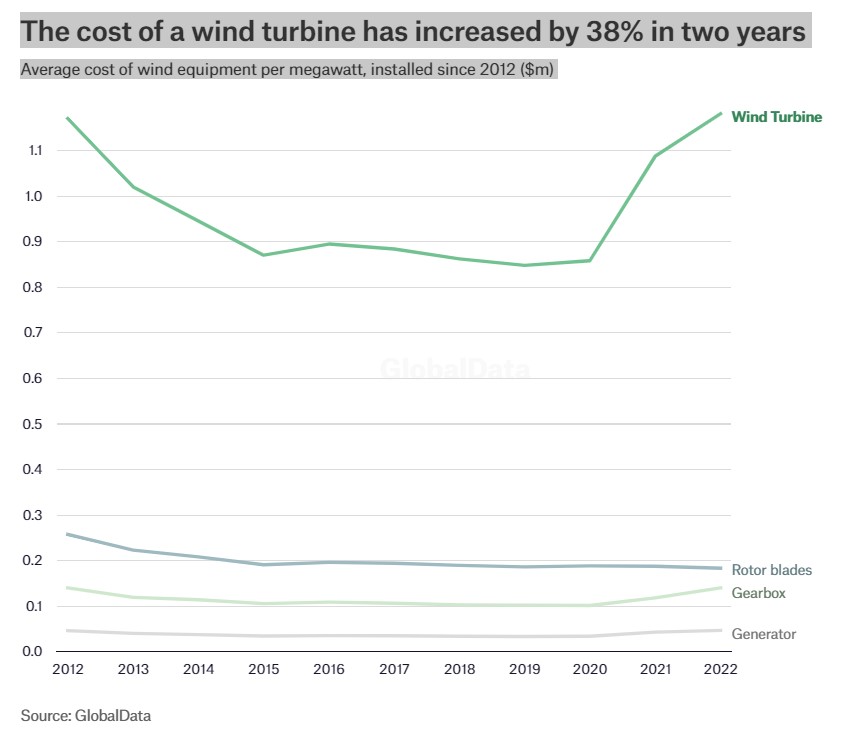
According to an analysis from Global Data, wind turbine costs increased by 38 percent in two years, essentially wiping out cost declines observed since 2012.
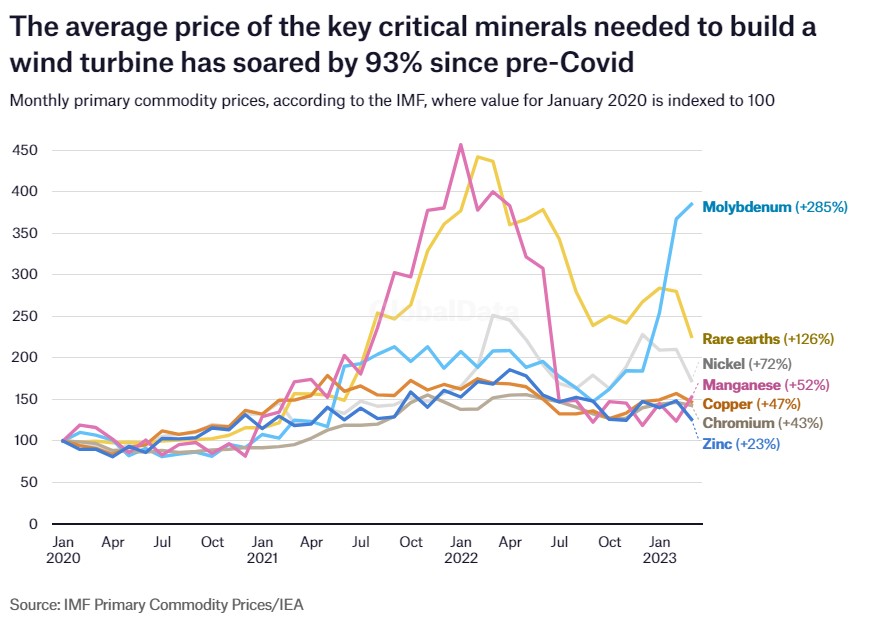
Turbine prices are up because of rising costs for copper, zinc, manganese, chromium, nickel, molybdenum, and rare earth elements, with prices rising for these commodities ranging from a 23 percent price increase for zinc to a 285 percent price increase for molybdenum. The average price increase of these seven metals over the period is 93 percent.
Rising metal prices and supply chain issues have also affected solar producers. However, solar faces unique challenges because of tariffs imposed by the U.S. for China’s unfair dumping policies and enforcement of the Uyghur Forced Labor Prevention Act (UFLPA), a bipartisan act signed by President Biden to crack down on China’s use of slavery in the solar supply chain.
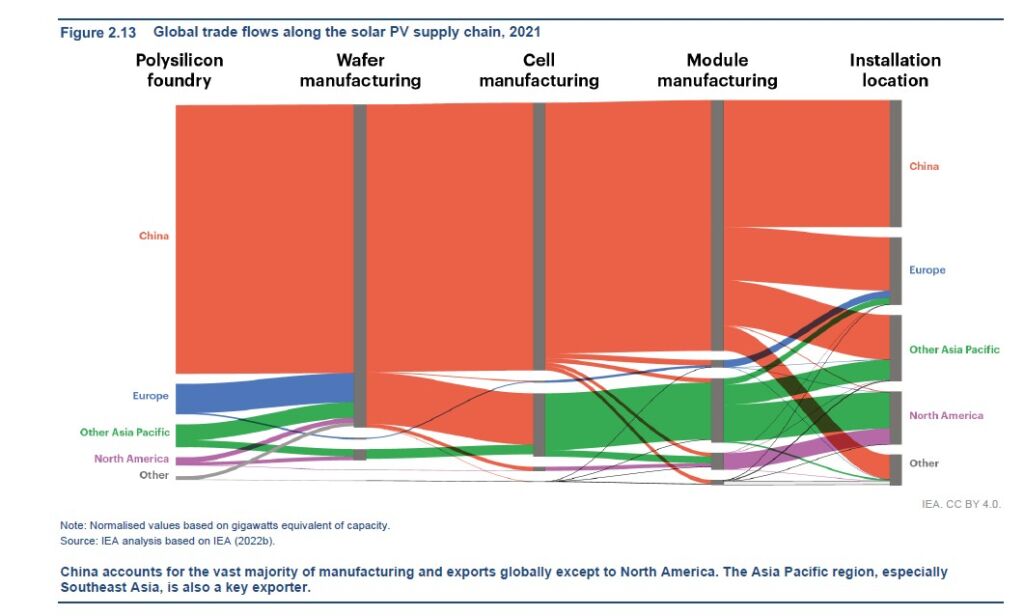
The tariffs against China have been difficult for the industry because China utterly dominates the supply chain for solar. The use of slavery in the sector is likely one reason why solar prices were falling in the first place, and tariffs seem likely to reverse that trend for the foreseeable future.
The days in which solar and wind experienced rapidly falling costs are over. Those days ended several years ago. Now, we face an uncertain future as wind and solar costs could see sustained increases. It’s time for policymakers and wind and solar boosters to update their models and stop assuming these technologies will see dramatic cost declines forever.