Windfail: Individual Wind Facilities Were Less Productive in 2018 than 2017 in Many Regions of the Country
Renewable energy advocates are seemingly always talking about how advances in technology will *finally* make wind and solar competitive with coal, nuclear, and natural gas without taxpayer subsidies. One of their arguments is that wind facilities are becoming more productive over time, generating more of their potential output, but recent data from Lawrence Berkeley Labs shows the productivity of wind turbines fell from 2017 to 2018 in many regions of the country, including Minnesota.
Productivity for power plants is measured by comparing how much electricity a power plant generates to its theoretical production potential. In industry lingo, this is called a capacity factor.
For coal, natural gas, and nuclear power plants, capacity factors show us how often the power plant operators used (or dispatched) that power plant to meet electricity demand. For weather-dependent sources of electricity like wind and solar, however, capacity factors show us how often the weather cooperated and allowed these resources to generate electricity. It turns out the weather was not very cooperative in 2018.
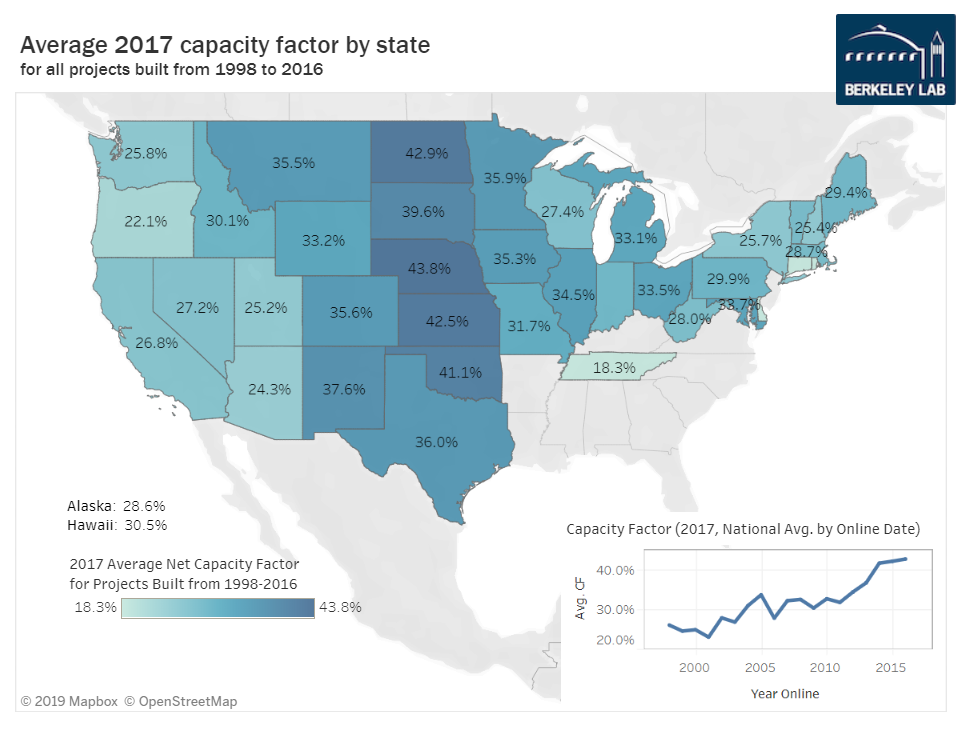
The map below shows 2017 statewide capacity factors for the United States. You’ll see that capacity factors in Minnesota were 35.9 percent for this year. Other Midwestern states have higher capacity factors because their wind resources are better, and because they used newer turbine models that are more productive than older models, as shown by the graph in the lower right-hand corner of the map.
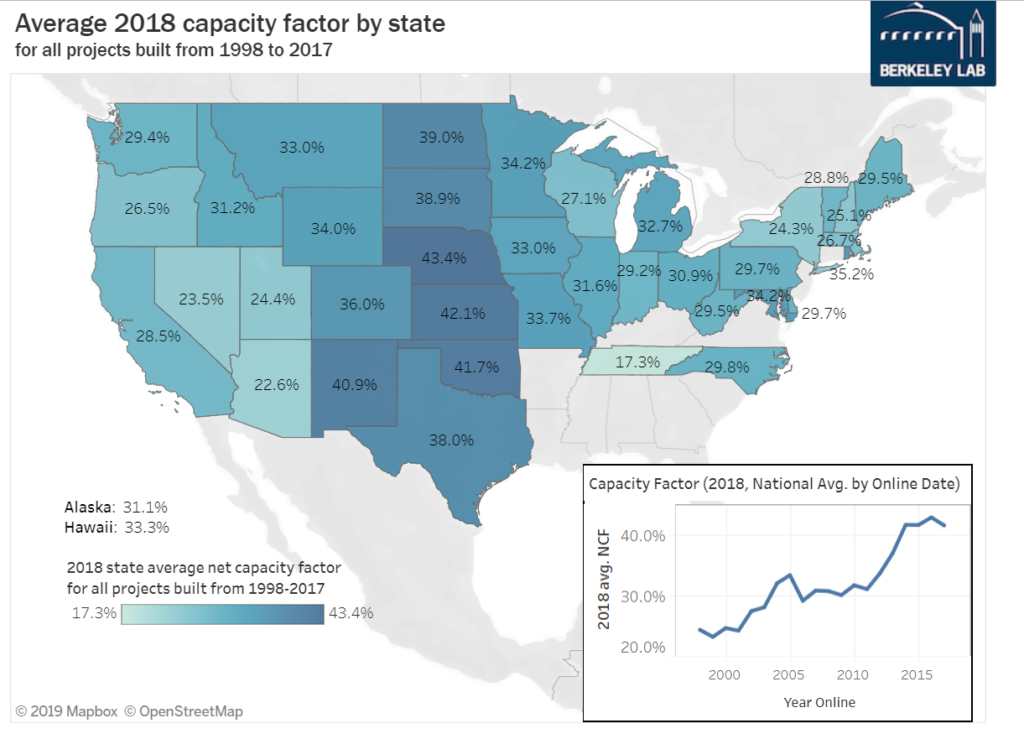
However, statewide, Minnesota wind turbines were not as productive in 2018 as they were in 2017, and this trend is also observed in Illinois, Indiana, Iowa, Kansas, Michigan, North Dakota, South Dakota, and Wisconsin.
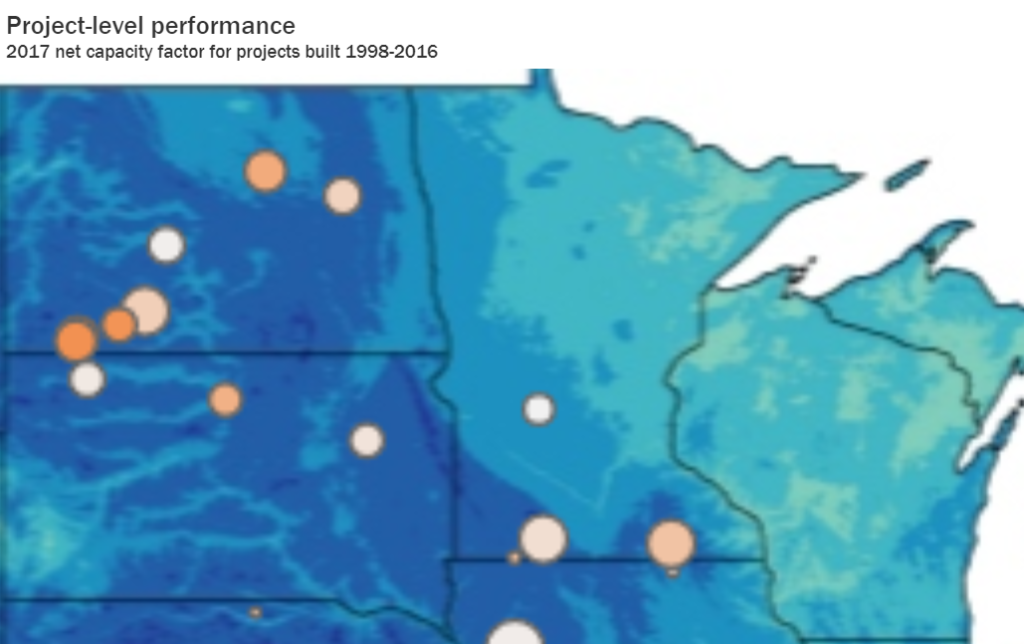
Falling statewide capacity factors could easily be the product of older wind turbines operating less efficiently and dragging down capacity factors for the entire wind fleet, but the data show newer wind facilities were also less efficient in 2018 than in 2017.
The Lawrence Berkeley Labs data is very cool because it lets you observe capacity factors at individual wind facilities throughout the country. In 2017, there were four projects in Minnesota that had capacity factors above 45 percent, with the highest capacity factor being 47.5 percent, which is actually pretty good for wind. North Dakota had seven projects over 45 percent, with the best capacity factor at 52.1 percent.
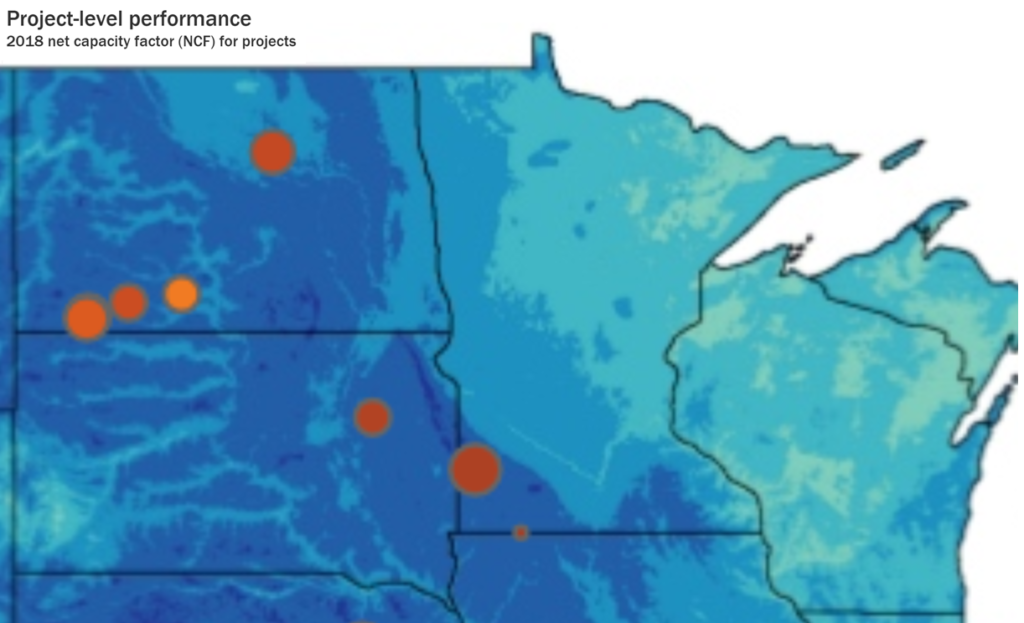
In 2018, capacity factors fell off the wagon, with only two projects in Minnesota over 45 percent (the highest being 45.6 percent) and North Dakota had five, with a maximum capacity factor of 49 percent.
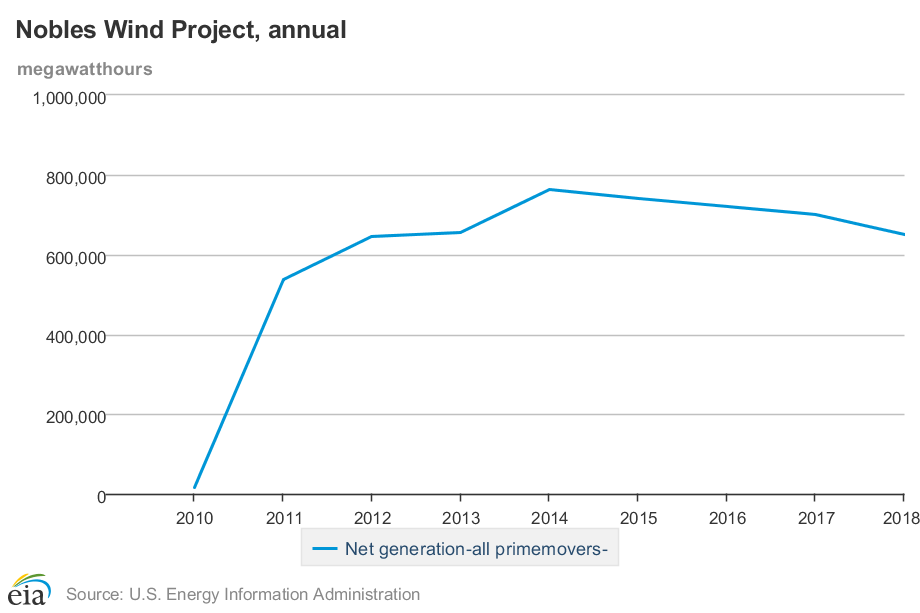
Declining capacity factors are likely a product of multiple factors, including reduced wind speeds and mechanical wear and tear. We’ve seen wind turbine output decline at individual facilities in a steady fashion, which makes me think that the declines aren’t just a product of variable wind speeds. If they were, I would expect more up and down movement in this graph showing production at the Nobles wind Project in the years following 2014, but then again it’s a small sample size.
Knowing that capacity factors are falling is interesting, but what’s more important is understanding how this influences the cost of wind power generators. In its latest Integrated Resource Plan, Xcel Energy bases their estimated cost of wind power assuming they will have capacity factors of 50 percent.
As we’ve seen, there are zero wind facilities in Minnesota that are currently produce this productive. If these assumptions are wrong, and I think we have good reason to be skeptical of them, it has very important implications for the cost of electricity generated from wind facilities.
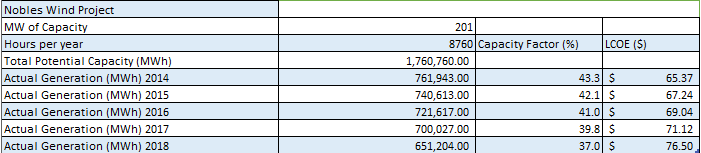
I’ve done a Levelized Cost of Energy (LCOE) analysis for the Nobles wind project in a previous blog post. As you can see, the capacity factor for this project has already fallen by about 5 percent, resulting in an $11 per megawatt hour increase in price. Preliminary 2019 data show Nobles is on pace to generate less electricity in 2019 than 2018.
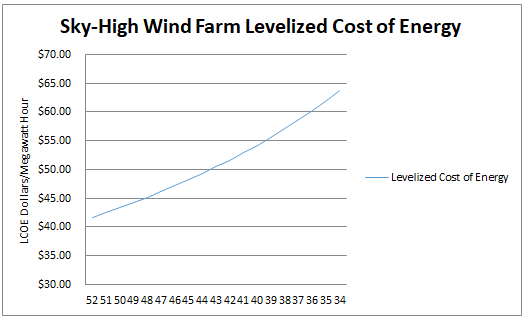
Declining capacity factors for wind facilities result in a higher increase in costs per megawatt hour than Minnesota’s coal and nuclear plants because wind facilities have lower capacity factors. As a result, a five percent decline in productivity for wind makes up a larger share of the energy produced by the facility compared to coal and nuclear. This is why we see exponential increases in electricity costs from wind facilities as capacity factors fall, as I explained in another blog post.
Falling capacity factors year-over-year are bad news for all American families and businesses in states where wind has been built because it means the levelized cost of energy produced from the turbines is increasing, not decreasing, over time. Most of these Americans live in states where electric utilities are government-approved monopolies, so they are forced by the government to buy electricity from these companies no matter how much electricity prices increase.
The only real solution to this problem is to allow consumers more freedom of choice. Only when electric companies are worried about losing customers due to rising rates will they have a financial incentive to stop building unreliable and expensive forms of electricity generation and get back to focusing on the prices borne by consumers.