How Minnesota’s COVID-19 model has been a total failure
On Wednesday, the Star Tribune reported that:
Predictive modeling that guided Minnesota’s initial response to COVID-19 is being “recalibrated” with the latest pandemic data and will offer new forecasts about the spread of the infectious disease.
…
Updated COVID-19 forecasts by researchers at the University of Minnesota and Minnesota Department of Health should be released by mid-July.
This will be the fourth version of the model which has guided the state’s response to Covid-19. Let us hop it is a substantial improvement on the previous versions which have been little short of disastrous.
74,000 dead in 16 months
On March 25th, Gov. Tim Walz issued his stay-at-home order (SHO), commanding Minnesotans to stay at home as much as possible until April 10th. “Buckle it up for a few more weeks,” he said, 13 weeks ago.
At the time Minnesota had suffered one death from Covid-19 and twelve people were in intensive care. But a model built over a weekend by the University of Minnesota School of Public Health and Department of Health forecast that things would get very much worse. Without mitigation, the virus could kill upwards of 74,000 Minnesotans and the state’s 235 intensive care beds (ICU) would be full within six weeks. The SHO would slow the spread of the disease, allowing time for extra ICU capacity to be built up: “The thing that Minnesota is going to do is ensure if you need an ICU, it’s there,” Gov. Walz said.
On April 8th, with 39 Minnesotans now dead from Covid-19 and 64 in ICU, Gov. Walz extended the SHO to May 4th. This decision was based on Version 2 of the state’s Covid-19 model.
This version modeled a number of scenarios. Scenario 3 – a ‘Long term SHO for most vulnerable’ – would have extended the SHO for those especially vulnerable to Covid-19, such as older adults and people of any age who have serious underlying medical conditions, but would have allowed other Minnesotans to get back to work observing CDC safe practices, permitting a substantial reopening of the state’s economy. Under this scenario, demand for ICU beds would peak at 3,700 on June 8th and 22,000 Minnesotans would die of Covid-19 over the next 16 months. Instead, Gov. Walz chose Scenario 4 which extended the SHO for all by four weeks. Under this scenario, demand for ICU beds also peaked at 3,700 but on July 13th, and again, 22,000 Minnesotans were forecast to die of Covid-19 over the next 16 months.
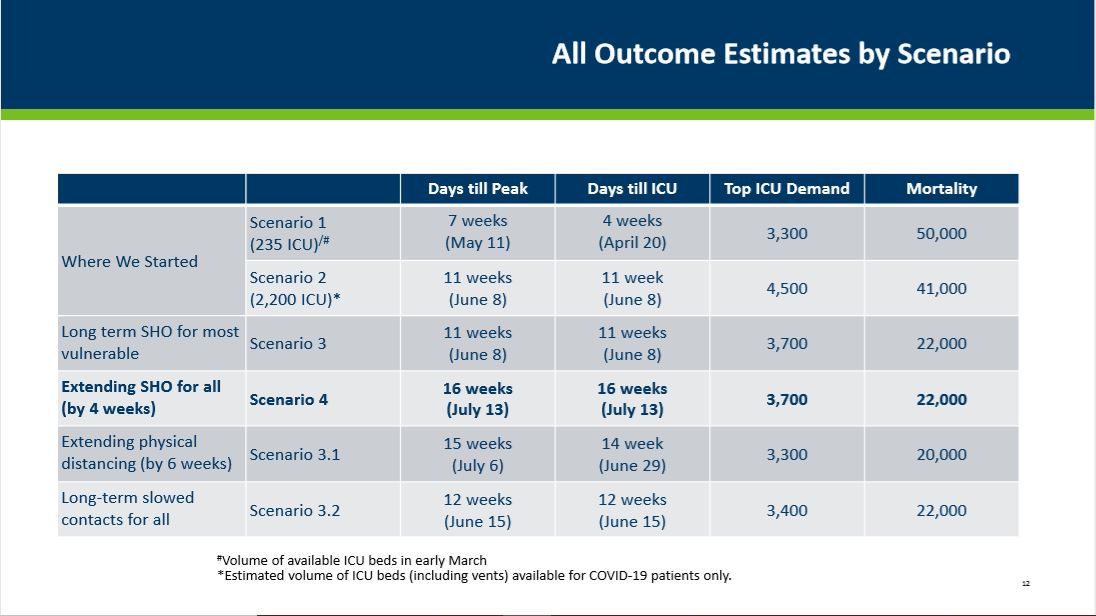
The only difference between the two scenarios, and the only reason for choosing one over the other, was the timing of the peaks. Scenario 4 bought more time for the state to build the ‘surge capacity’ necessary to cope with that peak of 3,700 Minnesotans needing ICU treatment for Covid-19 in mid-July.
On April 29th, Gov. Walz announced:
I today can comfortably tell you that, when we hit our peak — and it’s still projected to be about a month away — if you need an ICU bed and you need a ventilator, you will get it in Minnesota.
The aim of the March 25th SHO had been achieved, but he extended the SHO anyway to May 18th anyway.
1,441 dead by May 31st
On May 13th, the state government unveiled Version 3 its model. This forecast that with the SHO in effect to May 18th – the measures then in place – Minnesota would see 1,441 Covid-19 deaths by the end of May.
That seemed pessimistic to me. Up to that point, Minnesota had suffered 638 deaths from Covid-19 (subsequently revised down to 637) so to reach 1,441 by May 31st the state would need to see 45 deaths a day. Then, the record high of fatalities in one day was 30 (May 6th) and the average for the previous 18 days had been 22. In other words, the model which was driving state government policy forecast that the average daily death rate for the last 18 days of May would be double the average daily death rate for the previous 18 days. For the sake of curiosity, I made my own forecast that day. It was very basic: I simply took the current total number of deaths (638) and assumed that it would rise by 22 (the average of the previous 18 days) for the remaining 18 days of May. My forecast for total Covid-19 deaths in Minnesota by May 31st was 1,032.
The actual total was 1,039. Instead of averaging 45 deaths daily, Minnesota averaged just 22. Indeed, on no date did Minnesota see the 45 Covid-19 deaths a day the state’s model forecast. The state forecast was off by 401, or 28% lower than actually turned out. My back-of-an-envelope calculation, by contrast, was out by just eight, as Figure 1 shows. Indeed, as Figure 2 shows, nearly a month on, we are still below the number of deaths the model forecast for May 31st.
Figure 1: Minnesota Covid-19 deaths: forecasts and outturn
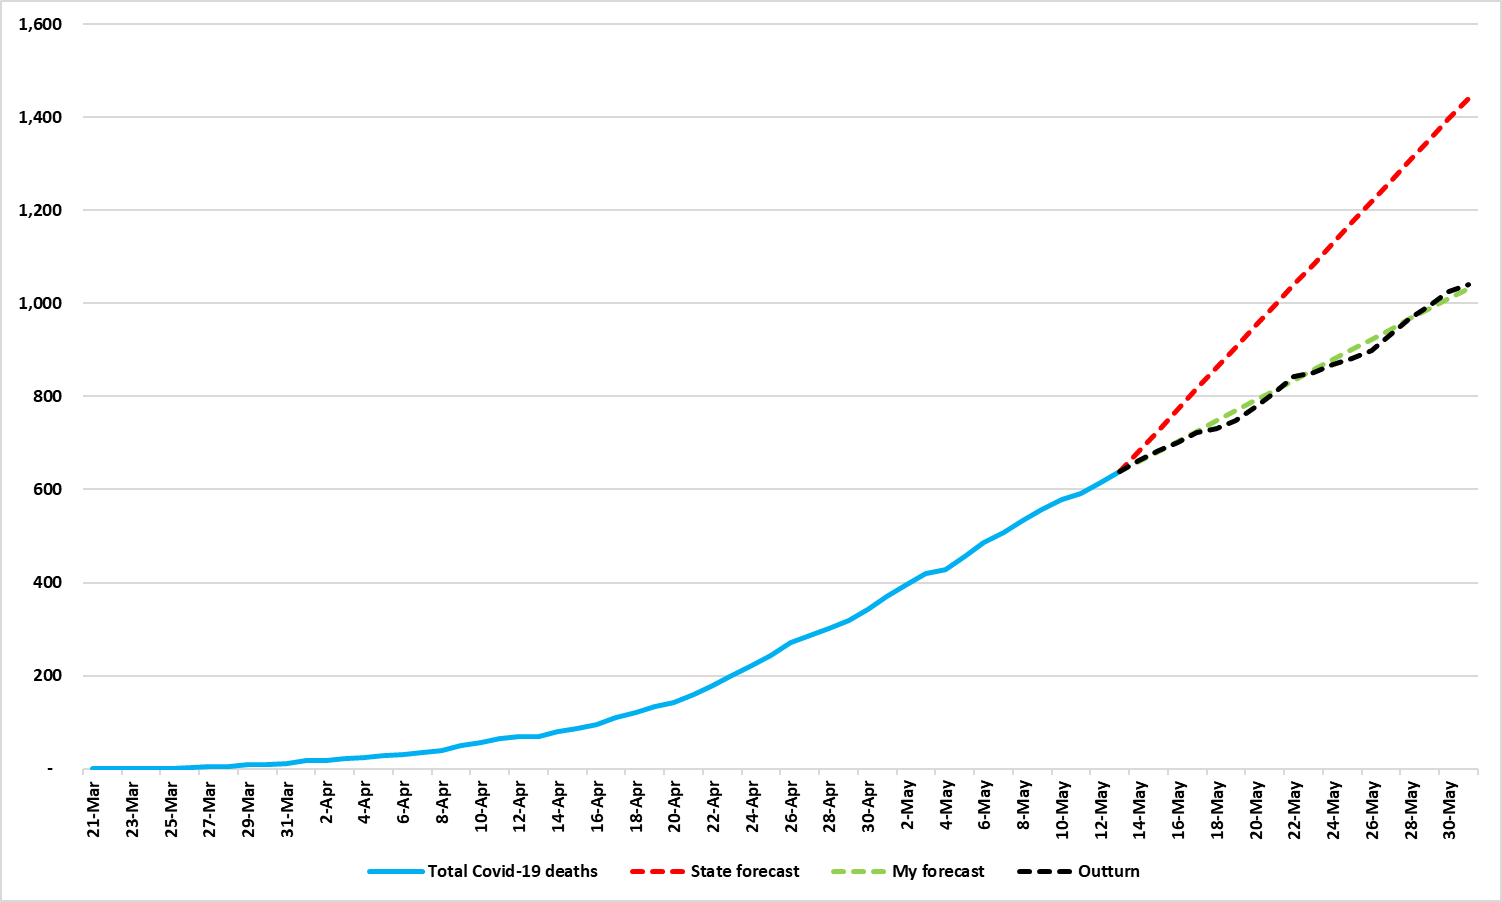
Source: Center of the American Experiment
Figure 2: Minnesota Covid-19 deaths: forecasts and outturn
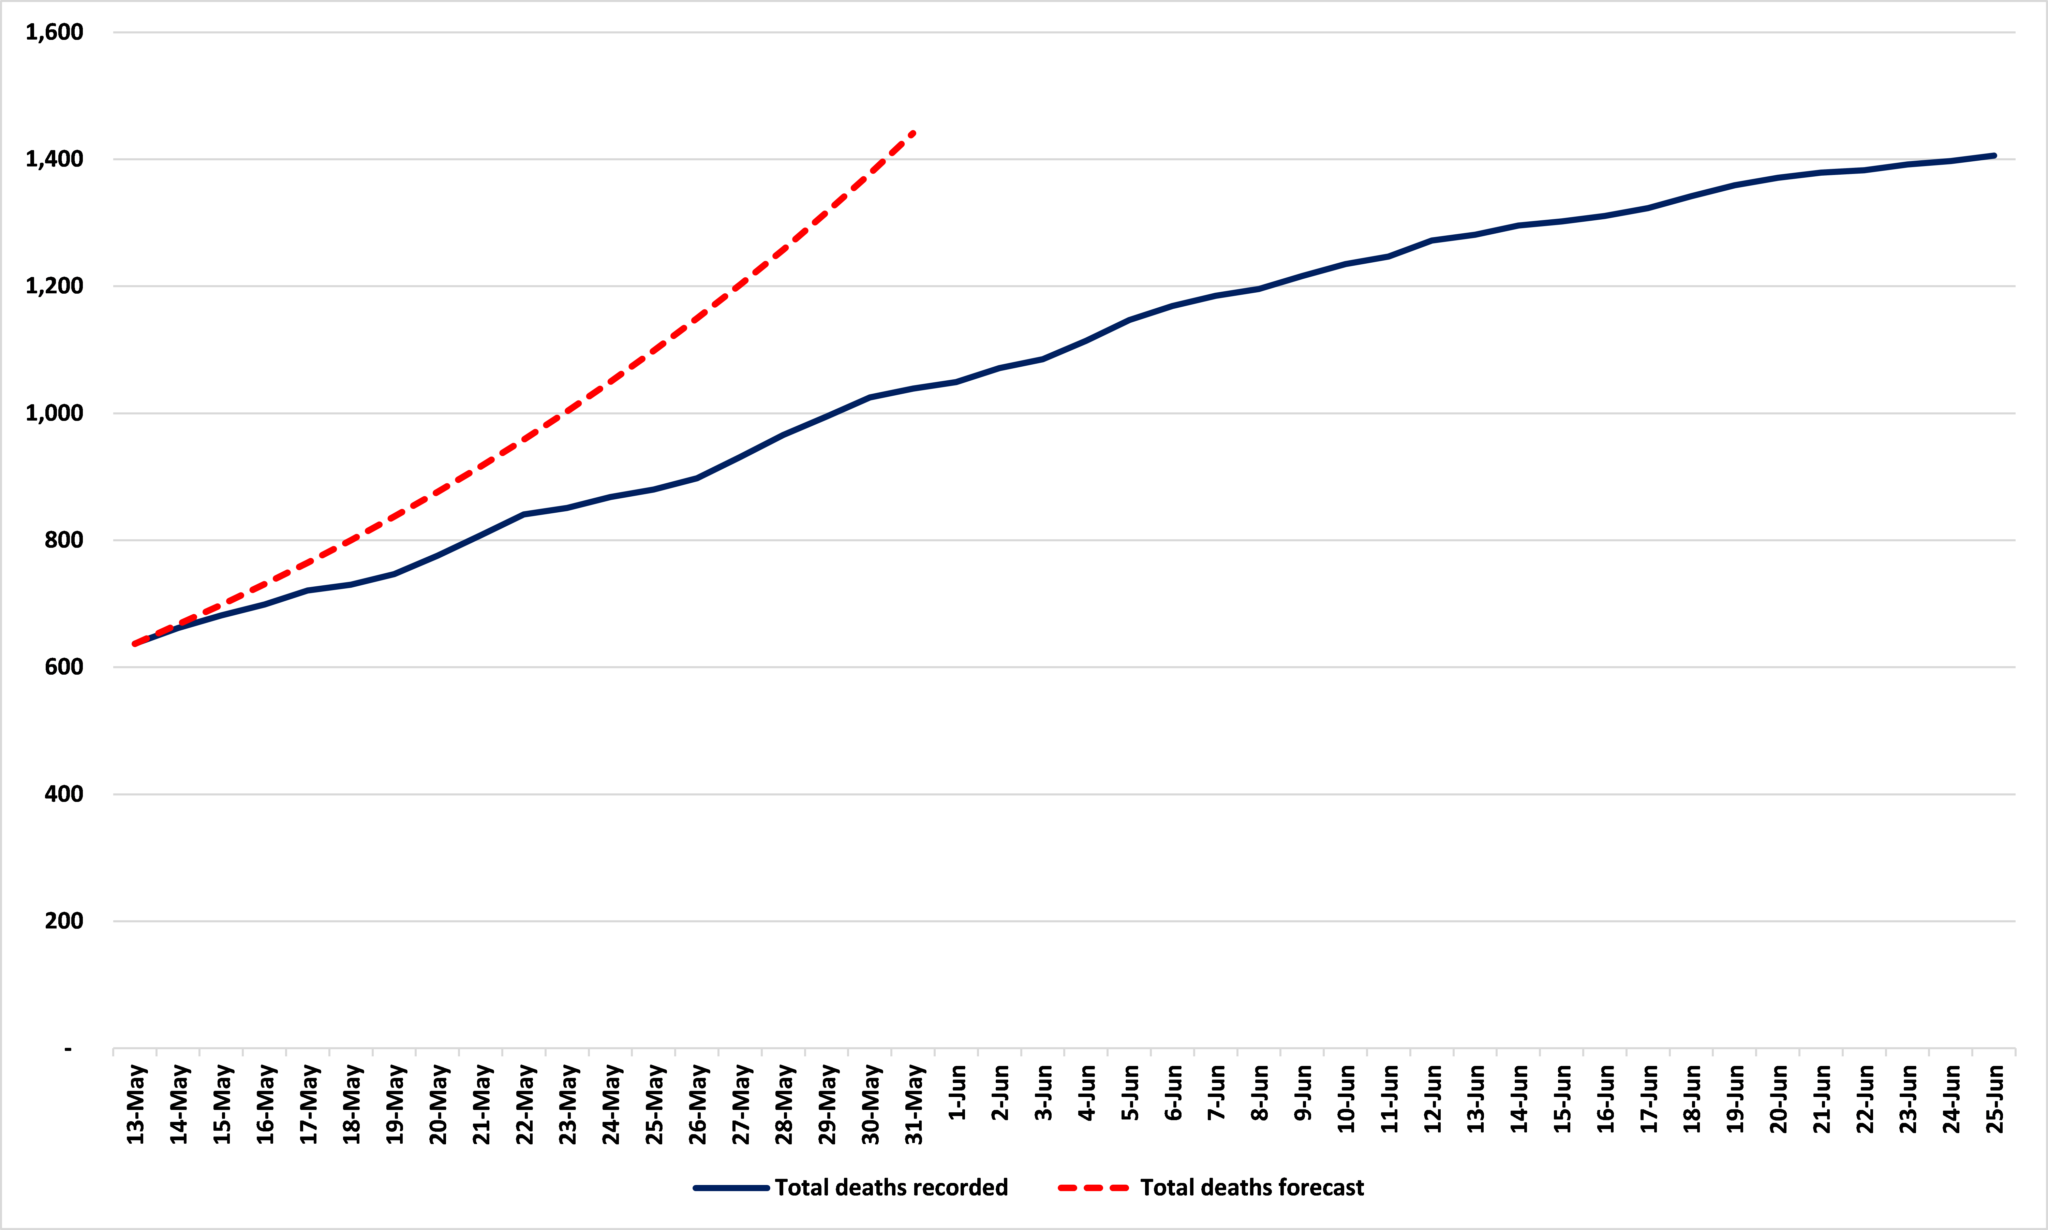
Source: Center of the American Experiment
3,397 in ICU by June 29th
Version 3 of the model also forecast, with the measures in place, a peak ICU use of 3,397 beds on June 29th. At that time Version 3 was released, there were 199 people in ICU with Covid-19. As of Thursday, there were 162, down from a peak of 263 on May 30th. If we assume exponential growth, then, as Figure 3 shows, we should have 2,668 Covid-19 patients in ICU at present. It looks like the model will be at least as badly wrong about ICU usage as it was about mortality, and it was on the basis of these forecasts that Gov. Walz shut down the state and kept it shut down.
Figure 3: Covid-19 ICU hospitalizations, forecast and actual
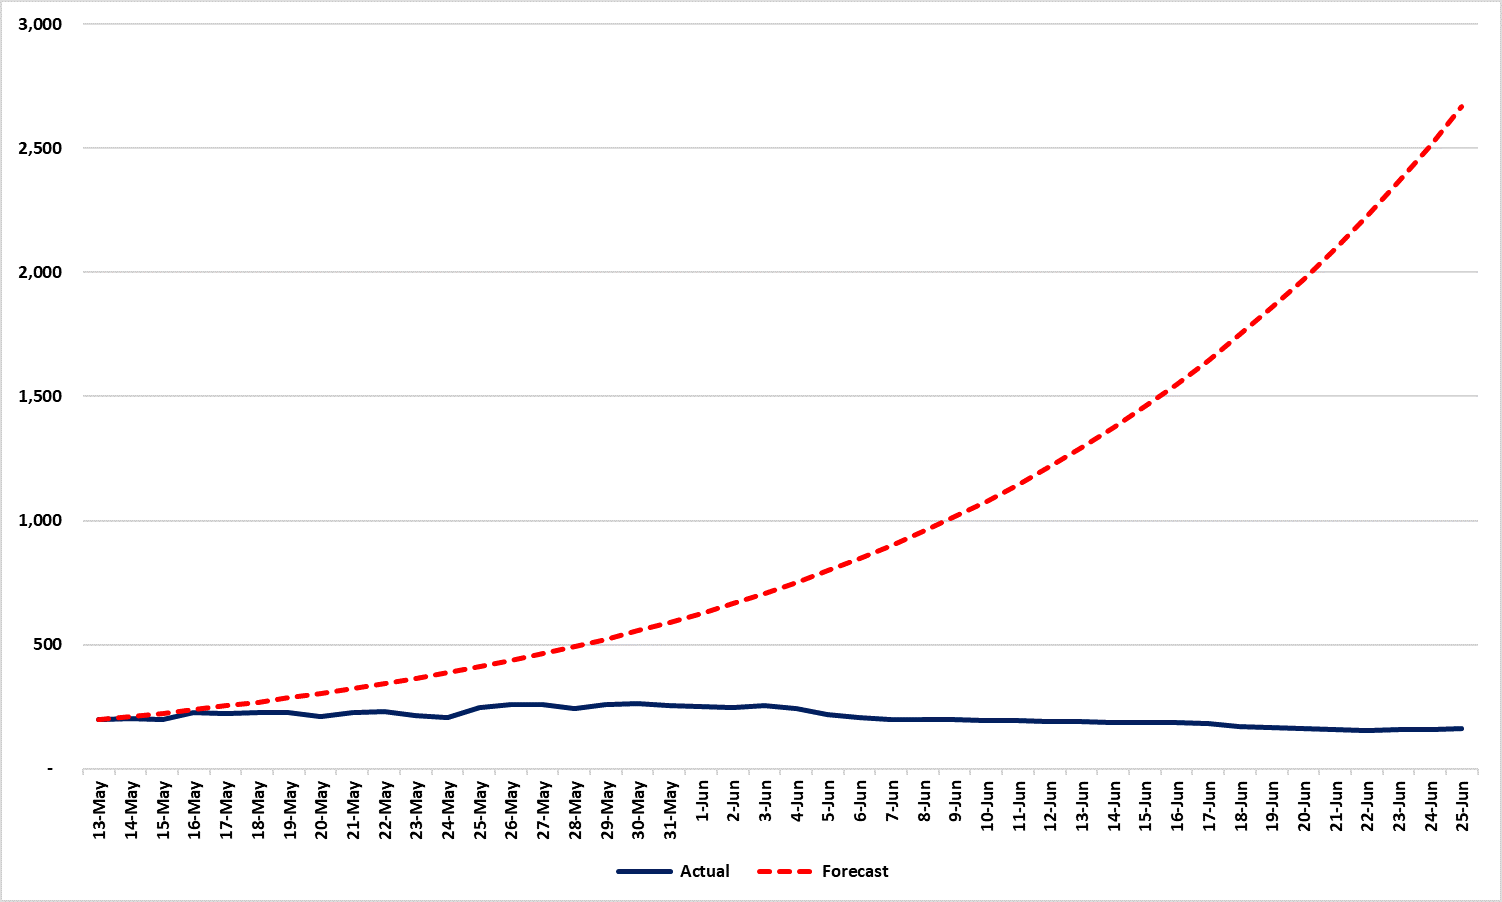
Source: Minnesota Department of Health
Assessing the failure of the model
Why has the model been such a disaster?
Let me say immediately that it is not because of adherence to the SHO. Some people argue that it is because of such measures that the state’s numbers have come in low, but, as noted above, the state’s forecast included these measures.
Neither should we defend the model on the basis that it ought not to be taken too literally. The Pioneer Press reports that:
Stefan Gildemeister, the state health economist who has acted as a liaison between the state and the U’s modeling team, said that while the number of deaths projected by the model is higher than reality, the direction is the same: up.
But, as a great Minnesotans once sang, ‘You don’t need a weatherman to know which way the wind blows’. In the same way, you don’t need a need a top secret model to tell you that, if people are locked in their houses, a communicable disease will spread more slowly and kill fewer people. Models don’t just point in which direction the effects will go. They also give – successful ones, at any rate – some idea of the magnitude of those effects.
The fault lies in the model itself. Quite simply, its parameters are wrong. The assumed values for things like the R0 value are too high and, as a result, it generates unrealistically pessimistic results. It needs either junking or radical reworking. But let us be under no illusion: the SARS-CoV-2 (COVID-19) Model, produced by the University of Minnesota School of Public Health and Department of Health, which has guided Minnesota’s policy response to the virus, has been a near total failure so far.
Where do we go from here?
Back in April, Gov. Walz said: “We cannot rest easy…This thing can explode overnight.” But what, then, is the endgame? We can’t keep the state under his personal rule indefinitely on the off chance that Covid-19 will ‘explode’ in a way it currently isn’t doing. Under what circumstances will Gov. Walz give up his dictatorial powers and return Minnesota to democratic government? What we need is a verifiable benchmark which allows us to say “These emergency powers are no longer needed.”
We have one. Gov. Walz has claimed throughout this crisis that he is being guided by the science and data. The model is a central part of that. Its forecast that, without mitigating measures, Minnesota could see 74,000 Covid-19 deaths was a key factor in prompting him to take those mitigating measures. As Figures 1 and 2 show, we have seen how, in the event, that model’s forecasts were way out when it came to total mortality. Figure 3 suggests that the same will turn out to be true of its forecast for hospitalizations.
If current trends hold and Covid-19 ICU usage is in the region of 250-300 on June 29th when the model forecasts 3,397, we will have every reason to junk it and many of the measures it has justified. And this ought to include Gov. Walz’ emergency powers.
John Phelan is an economist at the Center of the American Experiment.