Minnesota’s use of its COVID-19 model has been a disaster
On April 8th, Gov. Walz extended his stay-at-home order (SHO) to May 4th. In doing so, he explained:
We can say with 95 percent confidence that we are going to need a minimum of 3,000 beds starting in the middle of May. And that could be 3,000 beds as far out as the middle of July, depending on what we do social distancing-wise, and it could go higher.
This forecast was based on Version 2 of the SARS-CoV-2 (COVID-19) Model, produced by the University of Minnesota School of Public Health and Department of Health. This has driven state government policy relating to Covid-19.
As of yesterday, May 13th, the Department of Health says that there were 295 people hospitalized with Covid-19 and another 199 in Intensive Care Units, as Figure 1 shows. Since March 19th, just 647 Minnesotans in total have needed ICU care for Covid-19.
Figure 1: Total cases requiring hospitalization
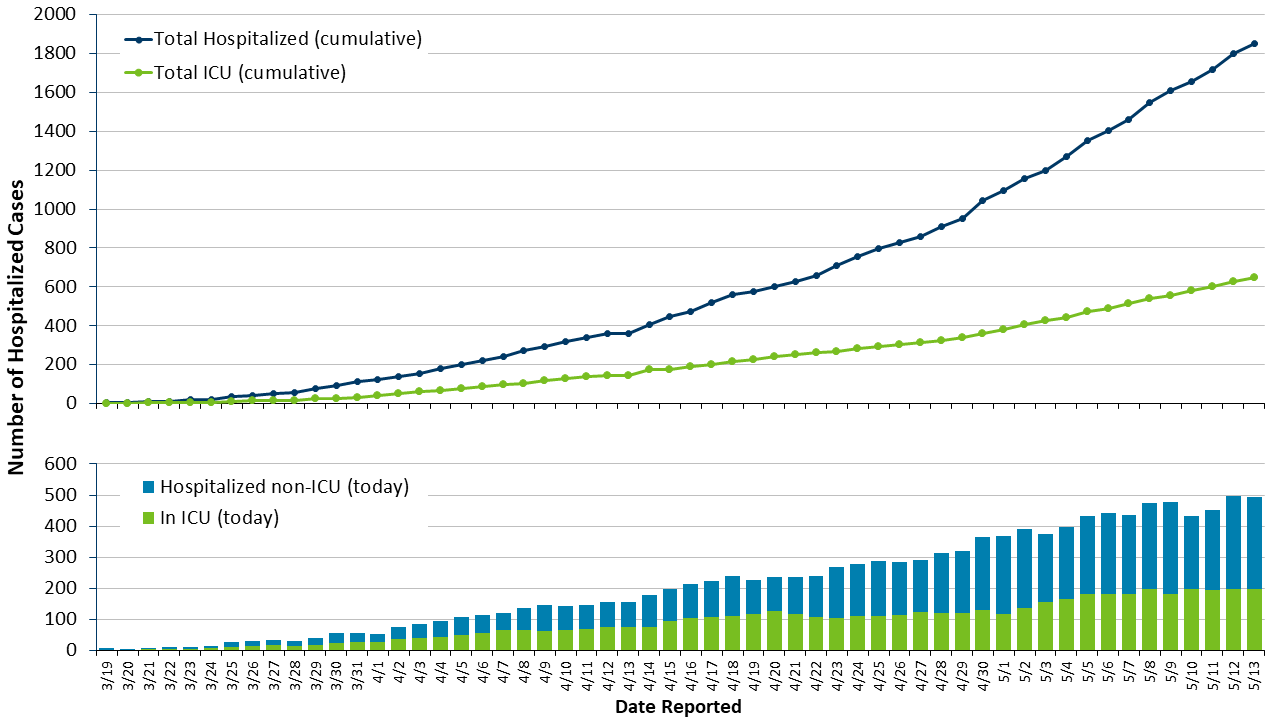
Source: Minnesota Department of Health
The forecast surge hasn’t come. The model was off by a factor of 15.
No, this isn’t because we extended the stay-at-home order
People usually respond with “That is because we have undertaken measures like social distancing”. This is completely wrong. The model includes those measures and their impacts.
Indeed, the whole point of the model is to give you some clear idea of what the results would be of implementing various measures. So, in April, the model’s Scenario 4 forecast peak ICU use of 3,700 beds on July 13th and 22,000 deaths over the next 16 months if the SHO was extended to May 4th. That was done and, as we see, we are nowhere near that.
Similarly, Version 3 of the model, released yesterday, forecast that with the SHO in place to May 18th – current arrangements – Minnesota will see 1,441 Covid-19 deaths by the end of May. Given the 638 deaths so far, that equates to a forecast of 45 Covid-19 deaths daily until May 31st. For comparison, the current high was 30 deaths on May 6th, the only day, in fact, when deaths have reached into the 30s. In other words, the latest version of the model forecasts that the average daily death rate for the next 18 days will be more than double the average daily death rate for the last 18 days. We will see if that comes to pass.*
It is possible that, without these measures, the numbers would have been higher. But, as we see, they would need to have been 15 times higher just to bring us into line with where the model said we would be with the measures in place.
This also goes against the argument – increasingly common as the model’s forecasts diverge ever further from observed outcomes – that these estimates aren’t meant to be precise and are only intended to illustrate general trends. You don’t need a need a top secret model to tell you that, if people are locked in their houses, a communicable disease will spread more slowly and kill fewer people. Models don’t just point in which direction the effects will go. They also give – successful ones, at any rate – some idea of the magnitude of those effects. We are entitled to judge Version 2 of the model a failure because its forecasts of ICU use were out by a factor of 15. If, by the end of May, the average daily death rate from Covid-19 has come close to doubling, we will be within our rights to judge Version 3 a failure too.
We can’t base policy on this
Frankly, the use of this model has been a total disaster.
That isn’t necessarily the fault of the modelers. As I have written before:
This is a brand new disease, the first identified case comes from November. We are learning new things about it all the time. As a result, our model inputs are changing. And, as a result of that, the model outputs are changing all the time.
Stefan Gildemeister, state health economist with the Minnesota Department of Health, made the same points in yesterday’s briefing. In my view, the modelers are making a sincere effort to grapple with the constantly changing state of knowledge about Covid-19.
But this uncertainty about inputs generates great uncertainty about the model’s outputs. And that, in turn, should make us skeptical of weighting them so heavily in decision making, especially decisions of such importance. Since Gov. Walz extended the SHO on April 8th based on model estimates we now know to have been off by a factor of 15, 236,720 Minnesotans have applied for unemployment insurance according to the Department of Employment and Economic Development.
*For comparison, the model from the Institute for Health Metrics and Evaluation (IHME) at the University of Washington’s School of Medicine which Gov. Walz referred to as “overly optimistic” and Commissioner Malcolm called “particularly optimistic” currently forecasts 1,245 Covid-19 deaths in Minnesota by May 31st.
John Phelan is an economist at the Center of the American Experiment.