Minnesota’s COVID-19 model is a disaster
A tale of two forecasts
On May 13th, the state government unveiled Version 3 of the SARS-CoV-2 (COVID-19) Model, produced by the University of Minnesota School of Public Health and Department of Health. This forecast that with the stay-at-home order (SHO) in place to May 18th – which it was – Minnesota would see 1,441 Covid-19 deaths by the end of May.
That seemed pessimistic to me. Up to that point, Minnesota had suffered 638 deaths from Covid-19 so to reach 1,441 by May 31st the state would need to suffer 45 deaths a day. Then, the record high of fatalities in one day was 30 (May 6th) and the average for the previous 18 days had been 22. In other words, the model which has been driving state government policy in response to Covid-19 forecast that the average daily death rate for the last 18 days of May would be double the average daily death rate for the previous 18 days.
For the sake of curiosity, I made my own forecast that day. It was very basic; I simply took the current total number of deaths (638) and assumed that it would rise by 22 (the average of the previous 18 days) for the remaining 18 days of May. My forecast for total Covid-19 deaths in Minnesota by May 31st was 1,032.
Yesterday, the Minnesota Department of Health announced that the state suffered 14 deaths from Covid-19 on May 31st to bring the total to 1,040. Instead of averaging 45 deaths daily, our state averaged just 22. Indeed, on no date did Minnesota see the 45 Covid-19 deaths a day the state’s model forecast. The state forecast was off by 401, or 28% lower than forecast. My back-of-an-envelope calculation, by contrast, was out by just eight, as Figure 1 shows.
Figure 1: Minnesota Covid-19 deaths: forecasts and outturn
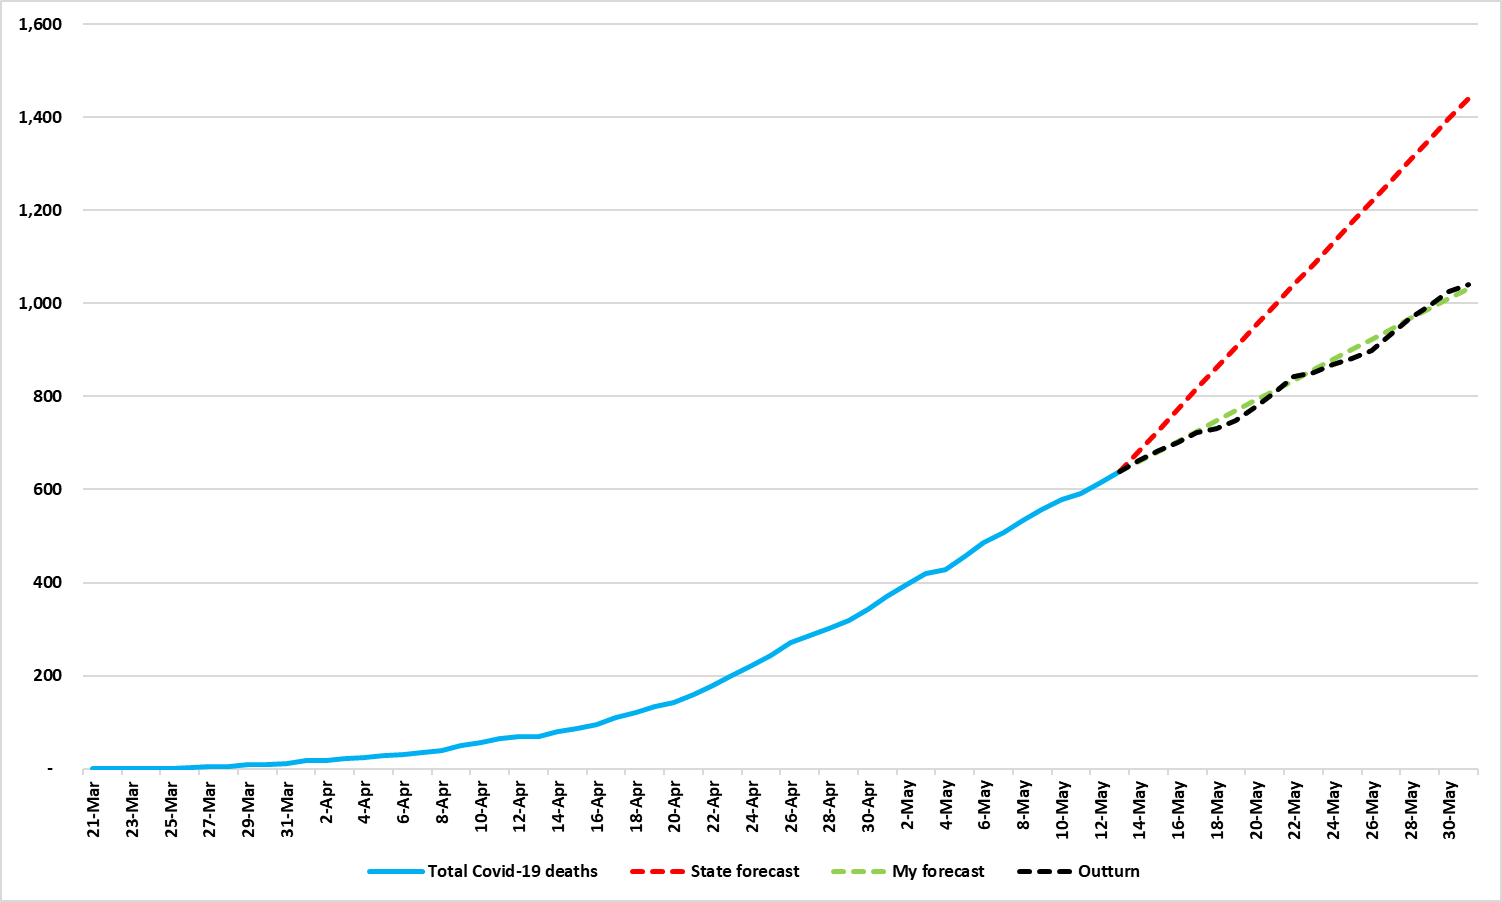
Source: Center of the American Experiment
Why was the state model so wrong?
This model has been one of the key drivers of Gov. Walz’ policy response to Covid-19. The numbers are now in and it looks like a disaster. The question ought to be asked: Why was it such a disaster?
Let me say immediately that it is not because of adherence to the stay-at-home order (SHO). As noted above, the state’s forecast included that. Besides, evidence on their movements suggests that Minnesotans took the SHO less seriously than they indicated to pollsters.
The fault lies in the model itself. Quite simply, its parameters are wrong. The inputs for things like the R0 value are too high and, as a result, it generates unrealistically pessimistic results. It needs either junking or radical reworking. Either way, state government policy should ignore it.
The Pioneer Press reports that:
Stefan Gildemeister, the state health economist who has acted as a liaison between the state and the U’s modeling team, said that while the number of deaths projected by the model is higher than reality, the direction is the same: up.
But, as I wrote recently:
You don’t need a need a top secret model to tell you that, if people are locked in their houses, a communicable disease will spread more slowly and kill fewer people. Models don’t just point in which direction the effects will go. They also give – successful ones, at any rate – some idea of the magnitude of those effects. We are entitled to judge Version 2 of the model a failure because its forecasts of ICU use were out by a factor of 15. If, by the end of May, the average daily death rate from Covid-19 has not come close to doubling, we will be within our rights to judge Version 3 a failure too.
The numbers are in and the model is a dog.
John Phelan is an economist at the Center of the American Experiment.