Minnesota’s ICU hospitalizations are down 6.2% from their November peak
This last week, Gov. Walz’ – in defiance of his own Department of Health’s data – extended his shutdown of Minnesota’s bars and restaurants into the new year. Some, driven to desperation, announced that they would ignore the Governor’s diktat. WCCO reported Attorney General Keith Ellison’s reaction:
“People will get sick and die because of you. Not only from COVID-19: if someone has a heart attack or a stroke or a car accident and dies because they can’t get an ICU bed that’s being used by someone who got COVID at your establishment, or got it from someone who got it at your establishment, that death is also on you,” Ellison said.
Such ranting and raving is par for the course. But what is the picture in Minnesota’s hospitals, particularly its ICUs?
Data from the Minnesota Department of Health, seen in Figure 1, shows that, as of the seven days up to and including December 16th, total average ICU hospitalizations in the state are down 6.2% – or 71 beds – from their peak of the seven days up to and including November 21st. The recent rise in non-Covid-19 hospitalizations has been more than offset by the decline in the number of Covid-19 patients: these are down by 18.9% – or 75 beds – from their peak of the seven days up to and including December 1st/2nd. Capacity remains at 1,212, 34% down from November.
Figure 1: ICU hospitalizations in Minnesota, seven day moving average
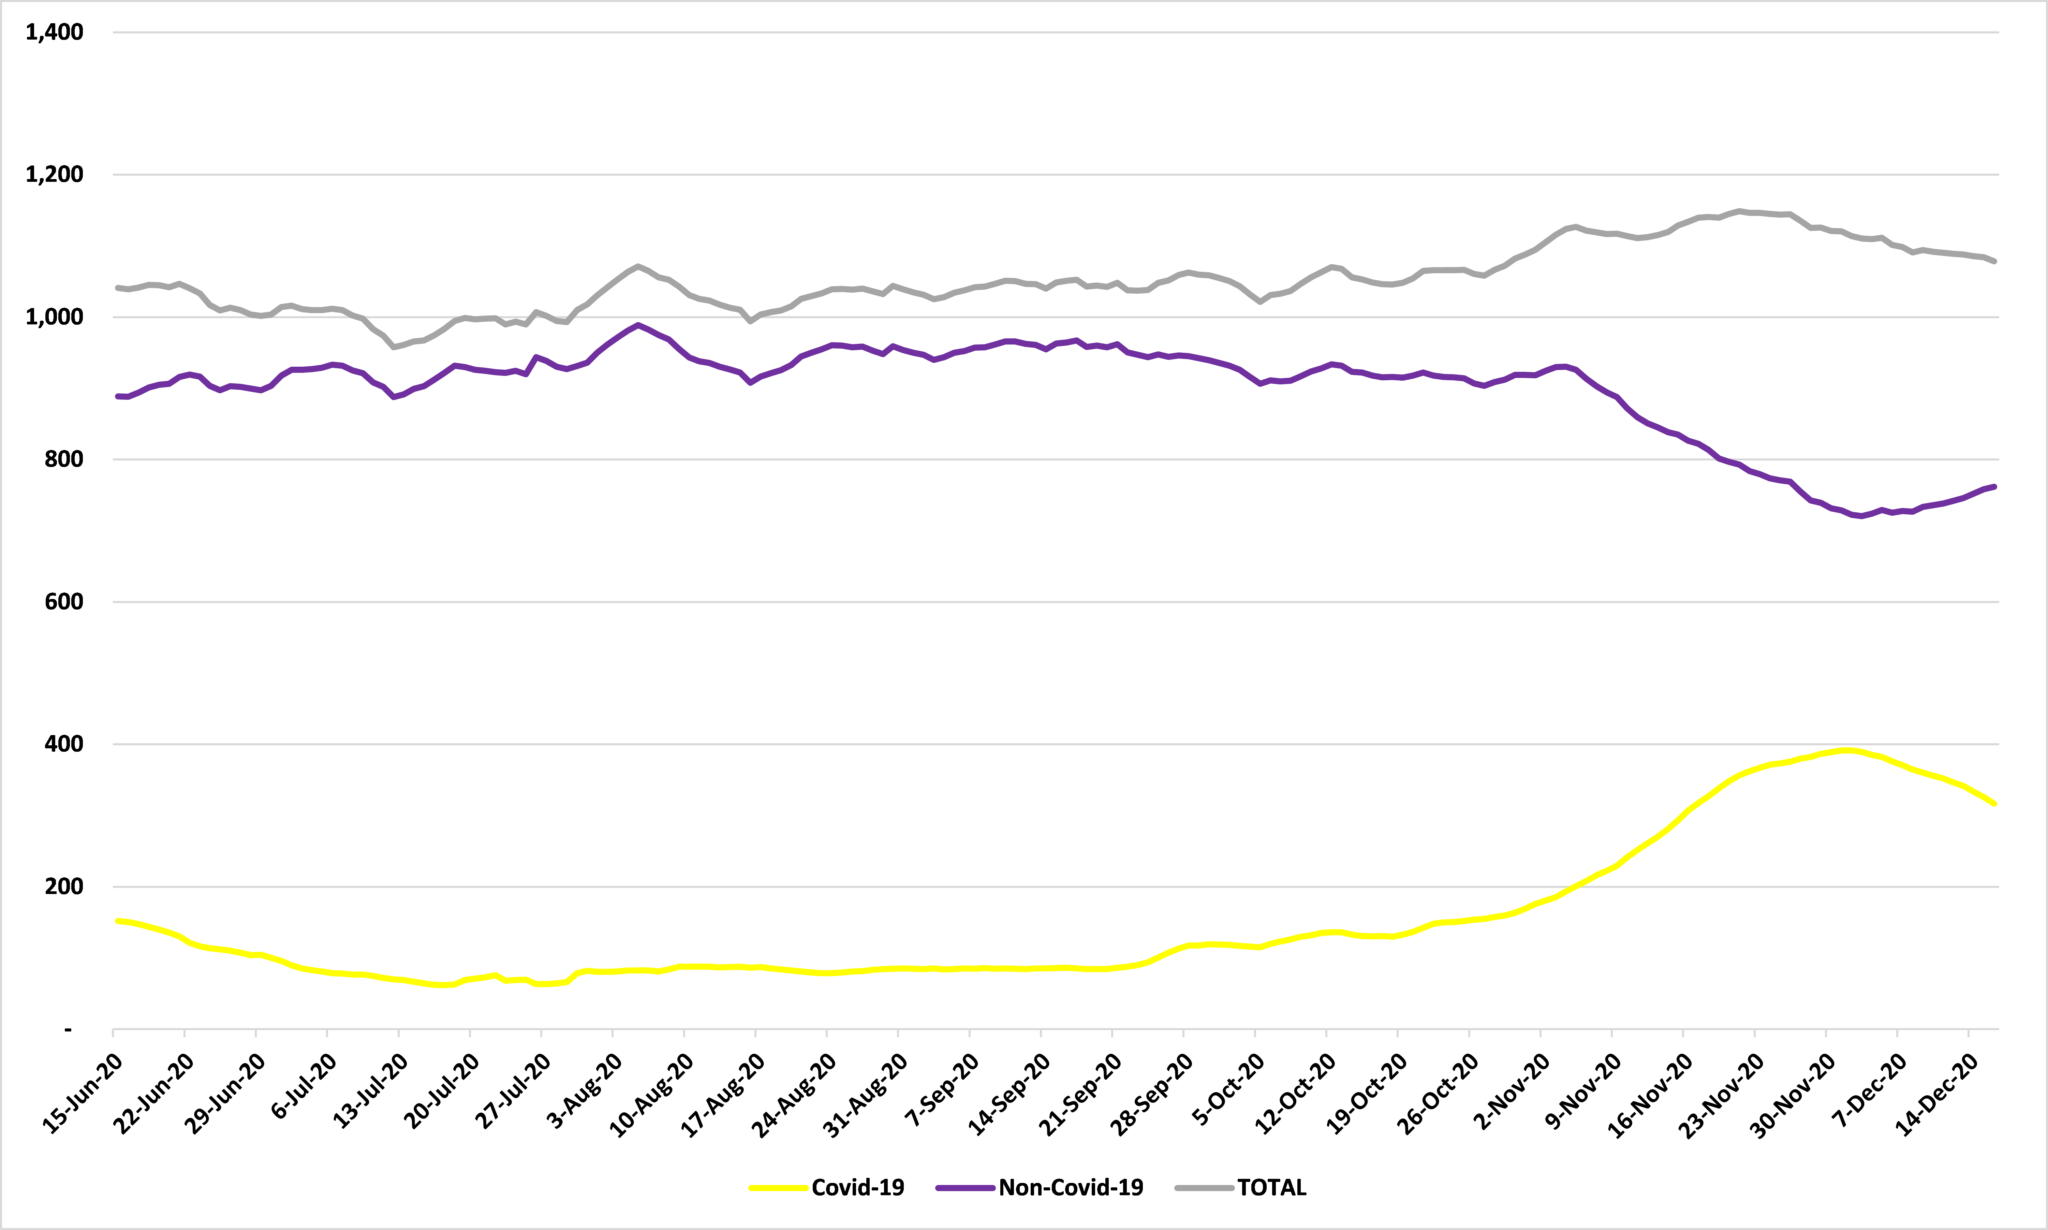
Source: Department of Health
The story is much the same with hospitalizations generally. In the seven days up to and including December 16th, total average hospitalizations in the state are down 12.5% – or 857 beds – from their peak in the seven days up to and including November 10th. Again, a recent rise in non-Covid-19 hospitalizations has been more than offset by the decline in the number of Covid-19 patients: these are down by 29.5% – or 422 beds – from their peak of the seven days up to and including November 25th.
Figure 2: Non-ICU hospitalizations in Minnesota, seven day moving average
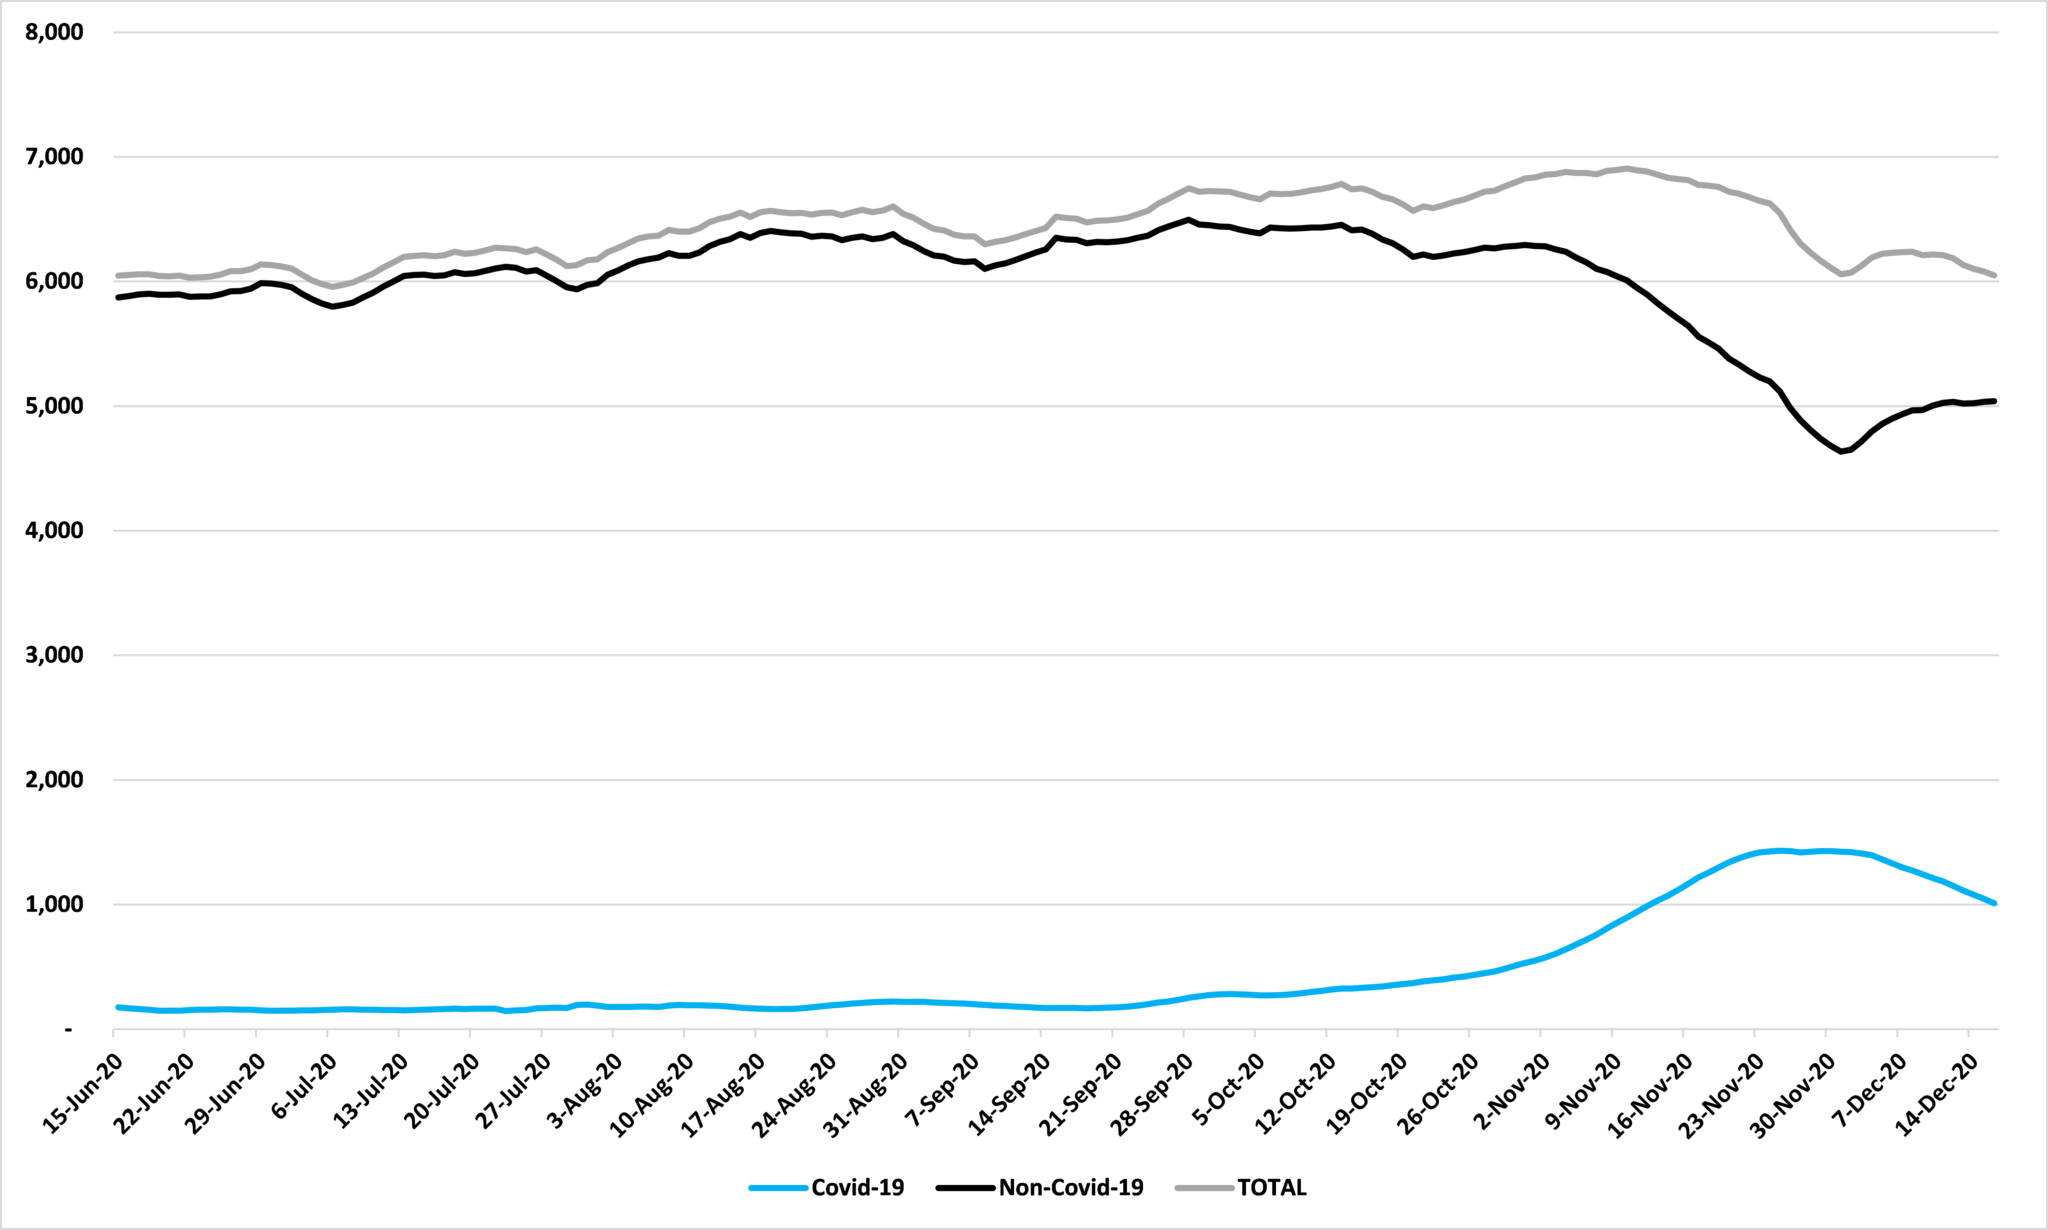
Source: Department of Health
These declines have brought a welcome easing of pressure on capacity, as Figure 3 shows. Staffed ICU bed availability ranges from 51.7% in Northwest Minnesota to 6.5% in the Twin Cities. For staffed non-ICU beds, availability ranges from 49.5% in West Central to a tight 3.0% in the Twin Cities. The impact of Covid-19 on hospitalizations and capacity varies widely across the state.
Figure 3:
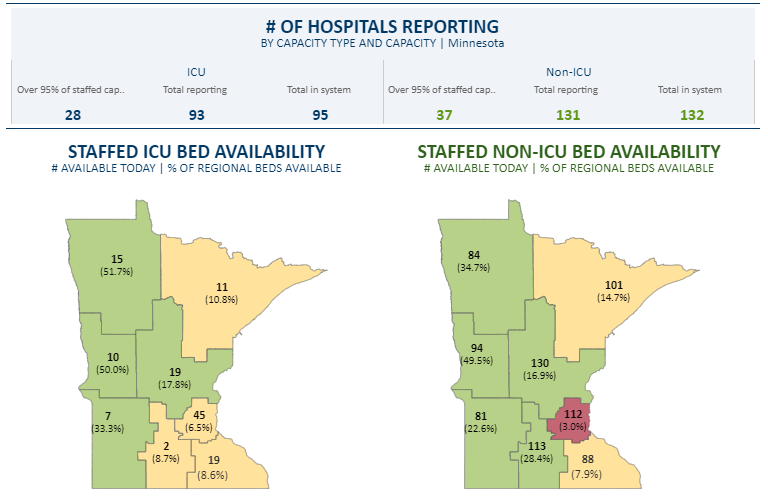
Source: Department of Health
We must, of course, remain vigilant. But with the media anxious to stoke hysteria over Civid-19, Attorney General Ellison could help by toning down his rhetoric.
Last week’s update can be found here.
John Phelan is an economist at the Center of the American Experiment.