As money growth slows, so does inflation
The relationships above give us a good basis to speculate on where inflation might be headed. The answer is ‘down’, and, perhaps, reasonably sharply.
Today, the Bureau of Labor Statistics (BLS) announced that:
The Consumer Price Index for All Urban Consumers (CPI-U) declined 0.1 percent in December on a seasonally adjusted basis, after increasing 0.1 percent in November…Over the last 12 months, the all items index increased 6.5 percent before seasonal adjustment.
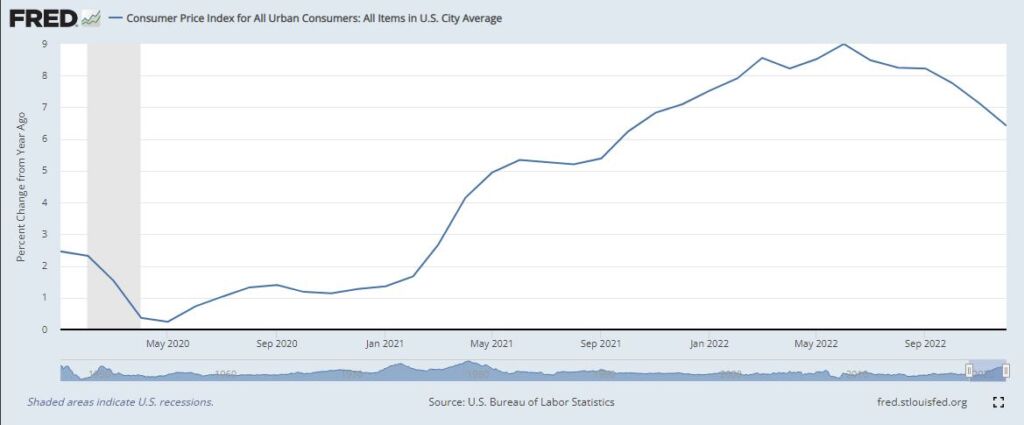
This is positive news in the fight against inflation. As Figure 1 shows, the monthly rate of inflation is down from June’s peak of 1.3% — indeed, December saw deflation. This declining month-on-month rate is also bringing down the year-over rate, as Figure 2 shows, which is down from the peak of 9.0% in June. The rate of inflation does seem to be heading down and doing so “reasonably sharply.”
Figure 1
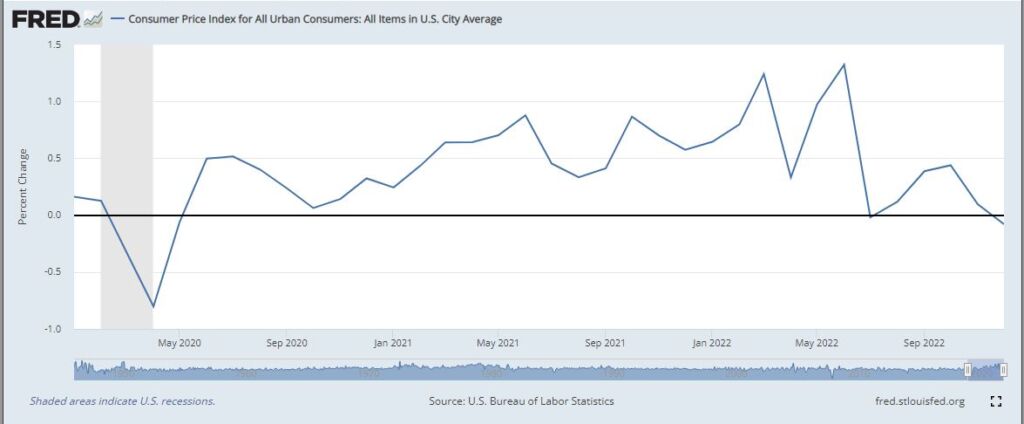
Figure 2
So what were the relationships I referred to in November? There were two: first, the relationship between the Monetary Base — a “narrow” measure of the money supply — and M2, a “broad” measure, and second, the relationship between M2 and the CPI.
Figure 3 updates one of November’s charts and shows the relationship between changes in the Monetary Base, which is directly controlled by the Federal Reserve, and changes in M2. The Monetary Base surged in early 2020 as the Fed printed money to buy U.S. government and corporate debt in an effort to keep borrowing costs down when borrowing surged as COVID-19 hit. Since April 2022, the year on year growth rate of the Monetary Base has been negative as the Fed has looked to drain liquidity from the system, essentially selling some of the assets it bought in 2020 and destroying the money taken in return. Of course, as these assets come on to the market, their prices drop and their yields — the interest rate on them — rise.
Figure 3: Monetary Base and M2, % change from a year ago
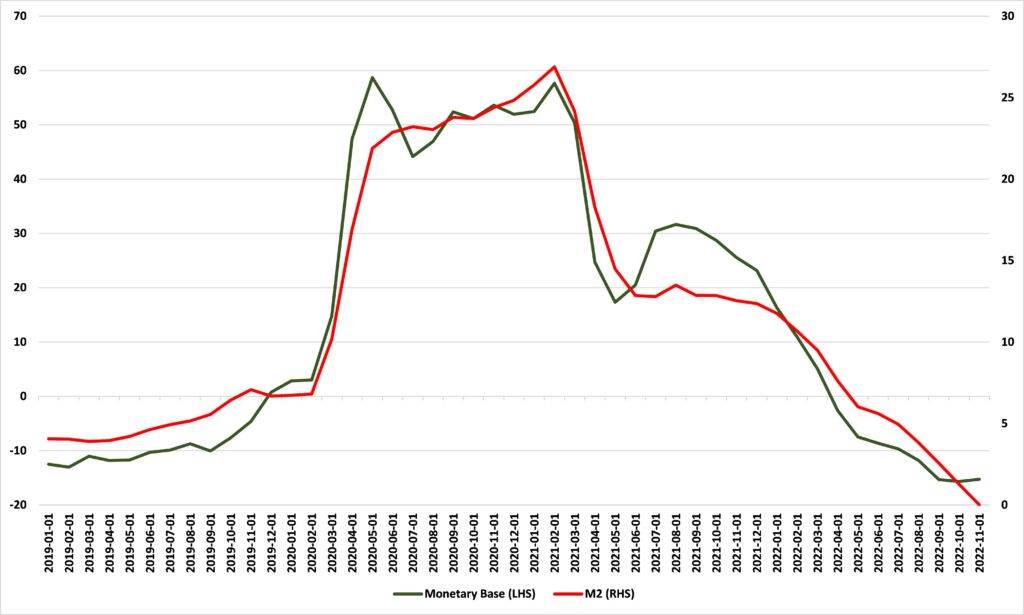
Figure 4 updates another of November’s charts, this time showing the relationship between changes in M2 and changes in the CPI. Because it takes some time for money to swill its way through the economy and bid prices up, I have lagged the M2 by 16 months. Just as the acceleration in the rate of growth of M2 caused an acceleration in the rate of growth of the CPI, so the deceleration in the rate of growth of M2 is causing a deceleration in the growth of the CPI. If this relationship continues to hold, we can expect the CPI to slow even further.
Figure 4: M2 and CPI, % change from a year ago, M2 leading by 16 months
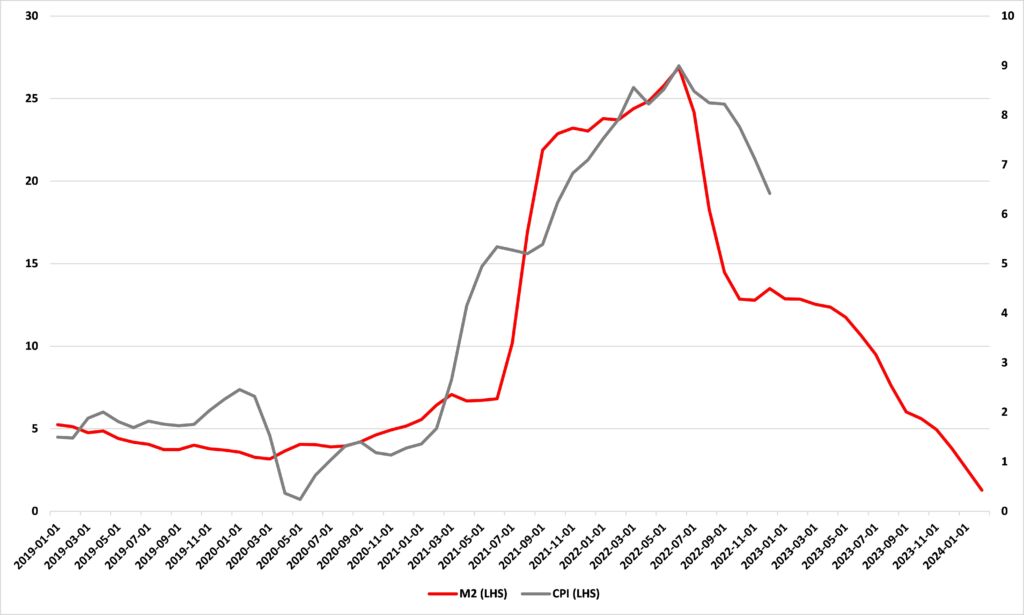
Recognizing the link between the growth rate of M2 and the growth rate of the CPI allowed me to see inflation coming back in 2021. It strongly suggests a sharp slowing of inflation ahead.