COVID-19 lockdowns and shutdowns cost each Minnesotan $1,900 over the first year of the pandemic
In March 2020, COVID-19 hit Minnesota. State and local governments enacted several measures intended to slow the spread of the virus, chief among these being “lockdowns” of individuals and shutdowns of certain “non-essential” businesses. Both at the state level and nationally, the economy contracted at the fastest rate on record and unemployment rocketed. More than two years on, economies across the United States are still recovering.
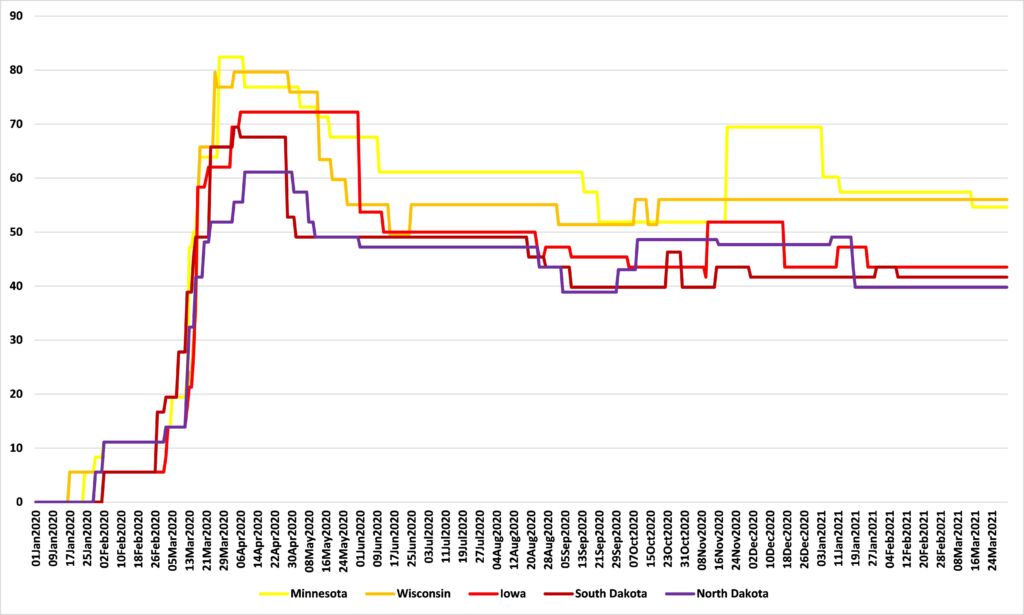
Different states pursued different policies in response to COVID-19. Figure 1 shows the daily stringency index compiled by the Blavatnik School of Government at Oxford University for Minnesota and its neighbors from January 1, 2020, to March 31, 2021. We see that all states tightened stringency significantly in March 2020, although the peaks differed somewhat. After that, the stringency values fall at different times and rates and reasonably large differences persist with Minnesota and Wisconsin generally more stringent than Iowa or the Dakotas.
Figure 1: COVID-19 stringency index
Did these differences in policy response account for differences in the observed economic outcomes? If so, how much of these differences were they responsible for? We seek to answer that question in our new report, ‘The Costs of Lockdowns and Shutdowns, Part I: Counting the economic costs of government policy responses to COVID-19.’
Using standard econometric methods, we find that government policy responses did account for some of the difference in the observed economic outcomes, so that more stringent anti-COVID-19 measures meant more economic damage in terms of lost Gross Domestic Product (GDP).
How much? Figure 2 shows the difference between actual GDP in the first quarter of 2021 and our estimate of GDP in that quarter without government policy responses to COVID-19. Hawaii suffered the greatest loss resulting from its government’s policy responses, with GDP lower by 4.2 percent (3.1 billion) in the first quarter of 2021 than it would have been without these responses. At the other end of the scale is Utah, whose government policy responses to COVID-19 imposed an economic cost of 2.1 percent of GDP ($3.9 billion). Minnesota’s GDP in the first quarter of 2021 was 3.1 percent ($10.6 billion) lower as a result of its government’s policy response to COVID-19, ranking it 25th.
Figure 2: GDP loss resulting from state and local anti-COVID-19 measures, Q1:2021
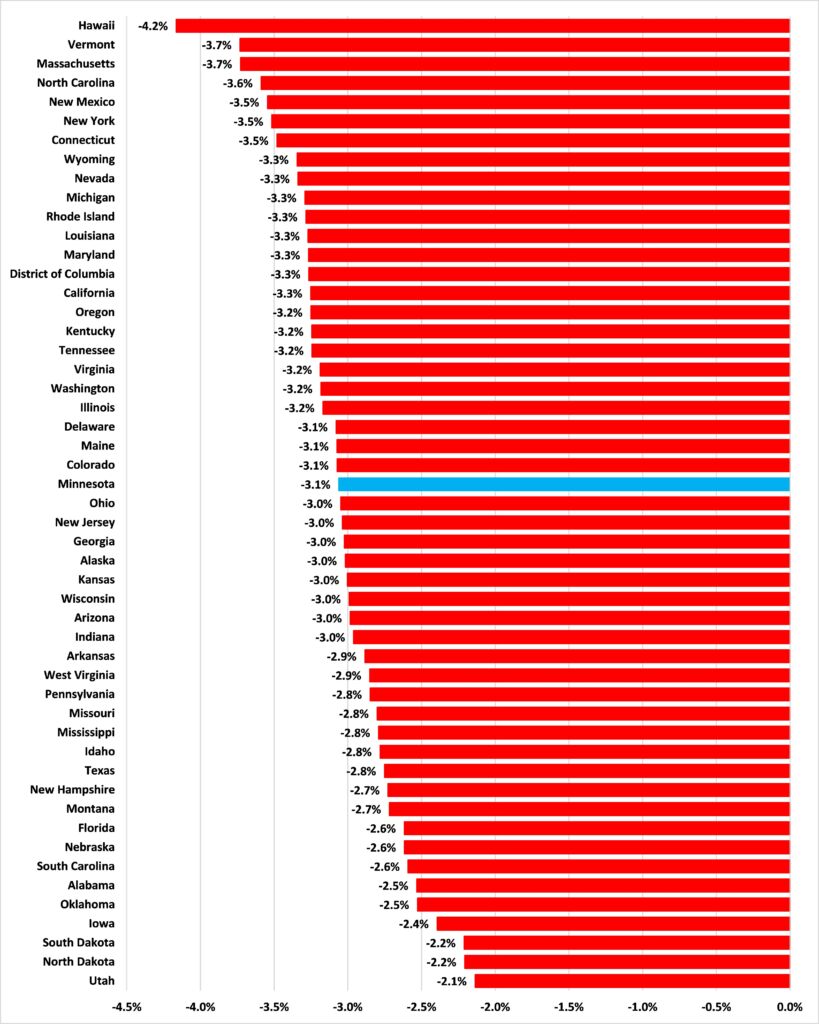
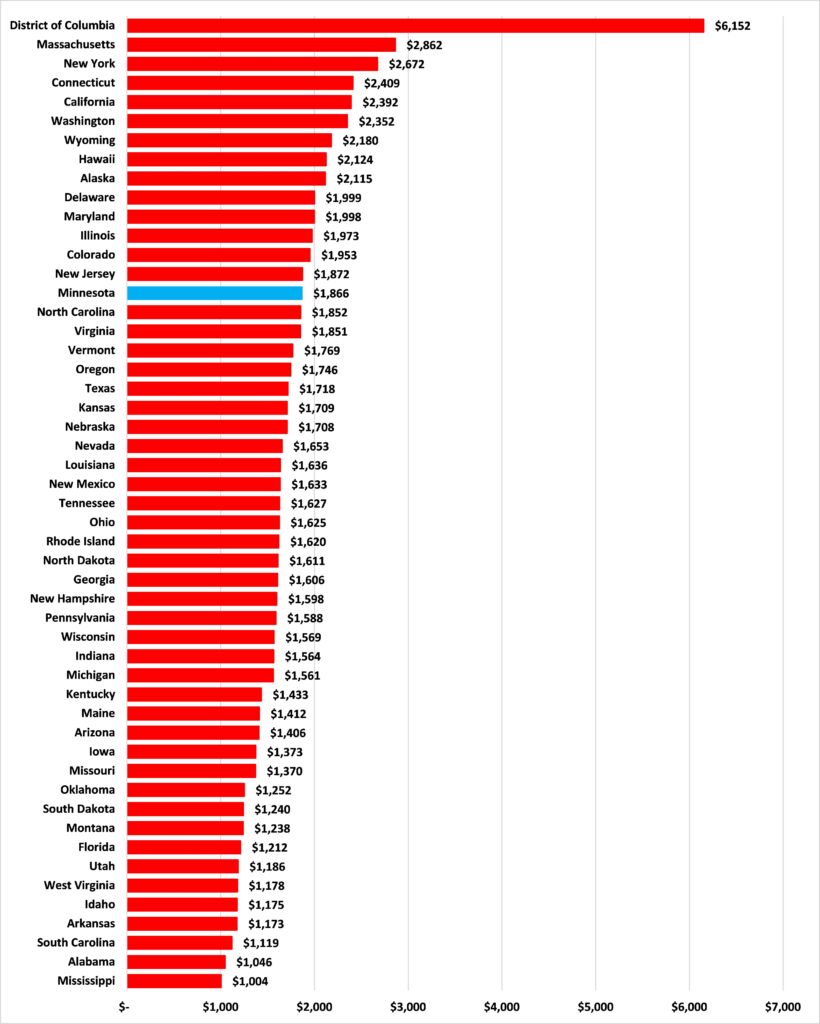
Figure 3 puts this into some perspective, dividing these dollar losses by the population to derive a per capita loss. Here, the District of Columbia was by far the worst hit jurisdiction with a per capita GDP loss of $6,152 by the first quarter of 2021 resulting from its government’s COVID-19 policy response. This should be qualified, however, by noting that it is one of the easier jurisdictions to move out of while still working and producing GDP there. Its population decline — 2.5 percent from 2019 to 2021 — was the steepest among the 51 jurisdictions, indicating that a fall in the denominator played a more significant role in the result of this equation than elsewhere. At the other end of the scale is Mississippi, whose government’s COVID-19 policy responses imposed costs of “only” $1,004 per person by the first quarter of 2021. Minnesota’s government policy responses to COVID-19 cost each resident $1,866 in lost GDP by the end of the first quarter of 2021, or $7,464 for a family of four: this was the 15th biggest hit in the United States.
Figure 3: Per capita GDP loss resulting from state and local anti-COVID-19 measures, Q1:2021
Public policy must be judged on its costs as well as its benefits. Our report attempts to quantify the economic costs of the unprecedented peacetime impositions on economic life by state and local governments in response to COVID-19. Such attempts are absolutely crucial to the evaluation of public policy.
These estimates do not say whether these policy responses were right or wrong. To repeat, their benefits, as well as these costs, must be weighed to make that judgement. The question, then, is what were the medical benefits of these policy responses, the lockdowns and shutdowns? Our report makes no attempt to answer that question, but, when such estimates are offered, we now have something to place in the other scale. We can now begin to answer the question of whether the cost of these policy responses — $7,464 for a family of four Minnesotans over the first year of the pandemic — were worth the benefits.