How do we measure social capital?
Over the last few weeks, I’ve written about how Minnesota and its neighbors have very different economic policies but very similar employment outcomes and how they have similarly high levels of what is called “social capital.” Might it be that higher levels of social capital account for some portion of the high rates of employment and household income seen in Minnesota and its neighboring states?
To begin to answer this question, I looked, last week, at what social capital is exactly. So, having defined it, how do we measure it? Fortunately, a number of attempts have been made to quantify social capital in the United States.
Previous attempts to measure social capital
Putnam combined 14 separate measures of social capital, such as levels of social trust and engagement in civic affairs, into a single Social Capital Index, which he then used to map levels of social capital for 48 of the 50 states. These measures covered the second half of the 1970s, the 1980s, and the first half of the 1990s, but not generally the same years. Alesina and La Ferrara also compiled a state-level social capital index in 2000 using measures of group participation, trust, and presidential election voting rates. Kim, Subramanian, Gortmaker, and Kawachi updated Putnam’s index in 2006, creating two state-level social capital indices from 10 of Putnam’s indicators. One index included community volunteerism, informal sociability, and social trust; the other included engagement in public affairs, and both included community organizational life. Kim subsequently produced another state-level index with Lee, which indicated the average number of formal and informal groups out of 15 different types in which adults participated.
Each of these attempts has been criticized, often on the same grounds. They rely on responses to surveys that were not conducted with the aim of producing an index of social capital at the state level. The surveys used by Putnam and Kim, Subramanian, Gortmaker, and Kawachi to update him, for example, were often conducted so that respondents would be representative of the United States as a whole, not of a particular state. The same criticism applies to Alesina and La Ferrara’s index, which used responses to the General Social Survey, and Kim and Lee’s index, which used the Annenberg National Health Communication Survey, both of which are designed to be representative of the United States generally.
A more recent attempt is the Penn State Index, which also includes estimates of social capital at the county level. However, this index leans heavily towards a narrow conception of social capital as captured by the numbers of establishments in religious organizations, bowling centers, or golf courses and country clubs. As the Social Capital Project notes, the Penn State Index:
…includes nothing on family health, volunteerism, charitable giving, informal community engagement, social support, or collective efficacy. Presidential voting and census mail-in rates are tenuous indicators of social capital, as they relate people primarily to federal, rather than local institutions.
Furthermore, “Several of the indicators suffer from interpretive or data Issues.”
Another recent attempt to quantify social capital, which, again, goes to the county and even zip code level, is the Social Capital Atlas. This is a comprehensive collection of data categorized as signifying either “Connectedness,” “Cohesiveness,” or “Civic Engagement.” No attempt is made, however, to build an index out of these indicators, and, as with the Penn State Index, it captures social capital as defined somewhat narrowly.
The Social Capital Project
This brings us to the Social Capital Index, another recent attempt to quantify social capital. It is produced by the Social Capital Project, which is run by the United States Congress’ Joint Economic Committee “to investigate the evolving nature, quality, and importance of our associational life — namely, our families, communities, workplaces, and religious congregations,” institutions which “are critical to forming our character and capacities, providing our lives with meaning and purpose, and addressing the challenges we face in an increasingly disconnected world.”
The authors write:
In our understanding of social capital, close and nurturing relationships with other people almost self-evidently provide benefits. Therefore social capital is likely to be “greater” or more productive in families, communities, and organizations with an abundance of close, supportive relationships. Social capital is also likely to be reflected in cooperative activities. These activities may be informal (e.g. conversing or working together with neighbors), or formal (e.g. membership in groups or service on a committee). Some cooperative activities may be formalized in institutions (e.g. governments, schools, news media, corporations), including nonprofit organizations specifically meant to deliver benefits or to represent interests. Social capital is also reflected in trust in other people, confidence in institutions, mutual generosity, high collective efficacy, and low social disorganization.
In our view, places where these features of social life come together have “high,” or “more,” or more productive social capital — features of social life that provide benefits to community and family members. Places with a dearth of these features have “low,” or “less,” or less productive social capital.
Figure 1: Social Capital Index and Subindex Scores by State
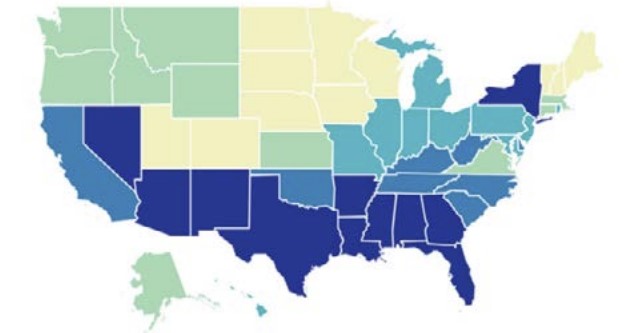
Source: Social Capital Project
Figure 2: Social Capital Index Scores
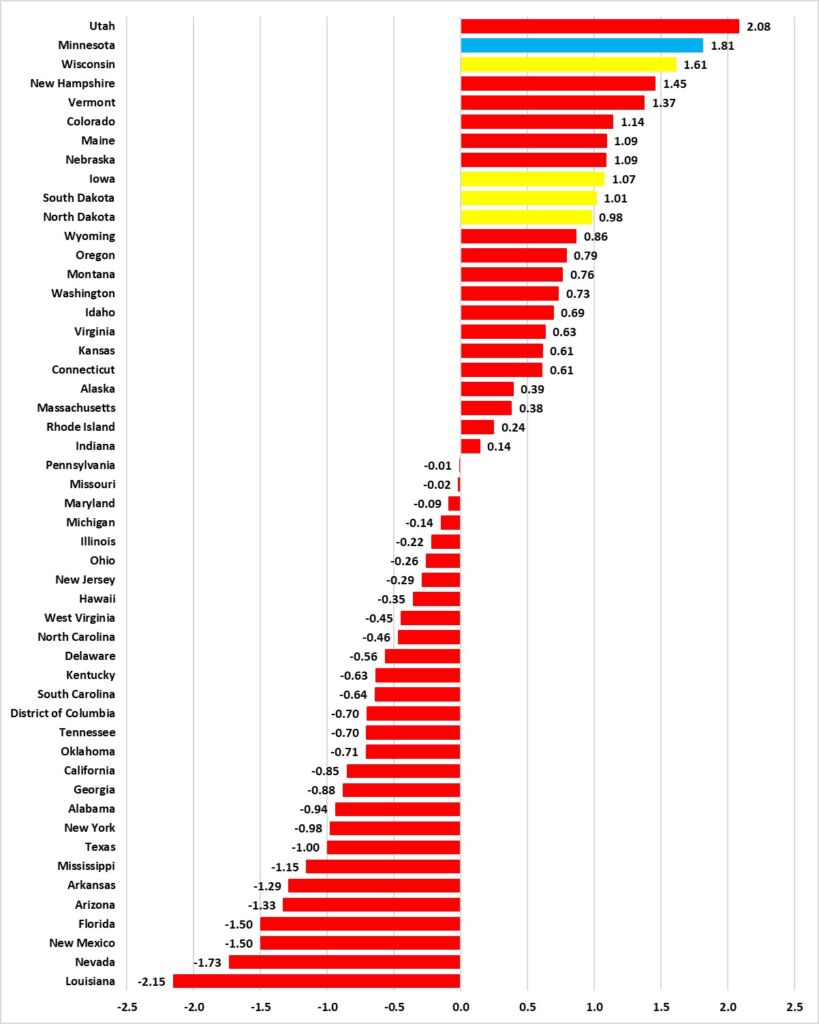
Source: Social Capital Project
To capture this, they have constructed an index of social capital at both the state and county levels (the state scores are shown in Figures 1 and 2). At the state level, there are five sub-indices — Family Unity, Family Interaction, Social Support, Community Health, and Institutional Health — and two stand-alone indicators — Collective Efficacy and Philanthropic Health. These sub-indices capture the quantitative (networks) aspect of social capital better than the qualitative (norms) aspect, though this is not unique. The authors note that:
…what is productive social capital for some—criminal networks, for instance—may appear to others to be deeply problematic. Many of the indicators that go into our index are about the extent to which people do things together, without regard to what they are doing.
Nevertheless, there is some qualitative judgment involved. The inclusion of a measure of married parenting and not gang membership, for example, suggests that this is an index of socially productive or “good” social capital.
Support for the Social Capital Project’s method comes from the overlap with previous estimates. Table 1 shows state index scores for Putnam, Alesina & La Ferrara, the Penn State Index, and the Social Capital Project ordered by the states’ average ranking over the indexes they appear in. 50 For each, the top 10 are highlighted in green and the bottom 10 are highlighted in red, with the exception of Alesina & La Ferrara, whose scale is one to four. There, the states with rankings of four are highlighted in green and those with rankings of one are in red. The correlation coefficient for the Social Capital Project’s index and the others is 0.81 for both Putnam and Alesina & La Ferrara and 0.37 for the Penn State Index. There is greater agreement between the various indexes at the top of the scale than there is at the bottom: there are three states that make the top 10 on all four rankings (Minnesota, South Dakota, and Iowa) and just one (Louisiana) which makes the bottom 10 in all four.
Table 1: Various Estimates of State Social Capital
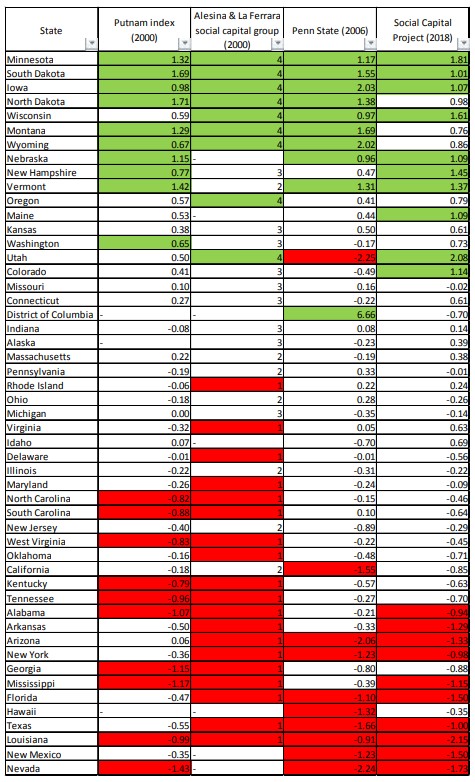
Source: Center of the American Experiment
Table 2 shows the Social Capital Project’s state-level index and the five sub-indices and two stand-alone indicators. It shows that the top two states, Utah and Minnesota, rank in the top 10 — highlighted in green — in six of the seven sub-indices, the best performance out of all the jurisdictions. Among the bottom 10 states, the worst performers are Louisiana, which ranks in the bottom 10 on all seven sub-indices, and Florida, which scores in the bottom 10 on six of the seven sub-indices.
Table 2: State Level Index of Social Capital with Subindices
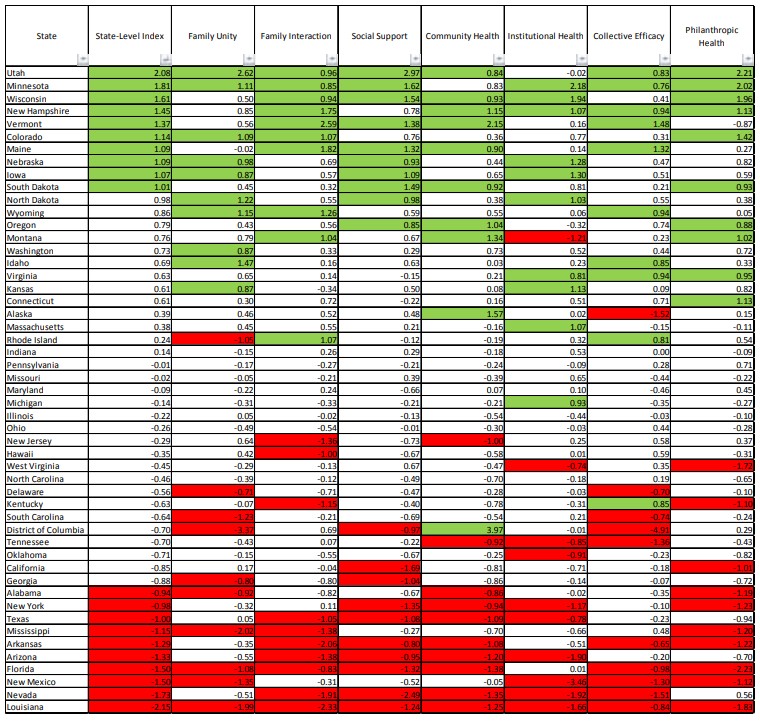
Source: Social Capital Project
Now that we have a quantitative measure of social capital, we can investigate exactly how it relates to economic wellbeing.
This article is based on our new report “The X-Factor? Social capital and economic well-being: A quantitative analysis.”