What do Minnesota and its neighbors have in common? Social capital
Last week, I noted that Minnesota and its neighbors have very different economic policies but very similar employment outcomes.
This holds over time. As Figure 1 shows, Minnesota and its neighbors have been spread across the Tax Foundation‘s State Business Tax rankings going back at least ten years (the red lines) while, over the same period, those employment outcomes – as measured by the employment ratio, the share of the population actually employed – have been concentrated toward the top of the rankings (the green lines).
Figure 1: State economic policy and employment outcomes

Source: Bureau of Labor Statistics and the Tax Foundation
Questions, questions
I asked: Why is that?
I am sad to say that few answers were forthcoming. One respondent noted that Minnesota and its neighbors had very different economies. Perhaps, but that, of course, simply asks the same question from a different angle: Given those differences, why are their employment ratios are so similar?
A more useful response noted that “Other states near the top in that ranking seem largely to have the common thread of really high educational attainment.” Perhaps, but the question is, then, why do states with different economic policies have such similar outcomes in terms of, what economists call, ‘human capital’?
Social capital
Its a headscratcher. As I say, going around Minnesota giving talks on the state’s economy, I often close by asking people for suggestions.
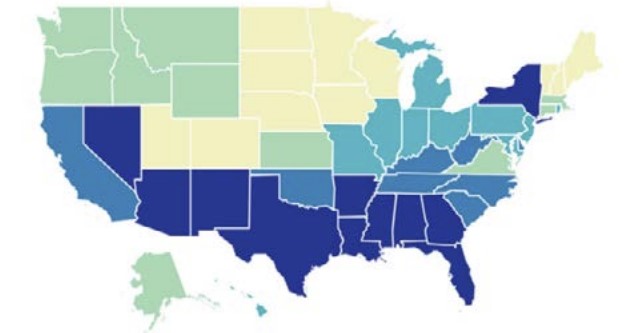
Then, one day, I saw the map in Figure 2 in a report titled The Geography of Social Capital in America produced by the Social Capital Project which is run by the Joint Economic Committee of Congress. The map shows each state’s “social capital,” with lighter colors denoting higher levels. Minnesota and its neighbors stand out for their high levels of social capital, just as they do for their high employment ratios. Our state ranks 2nd, Wisconsin 3rd, and Iowa, South Dakota, and North Dakota occupy the 9th, 10th, and 11th places respectively, as Figure 3 shows.
Figure 2: Social Capital Index and Subindex Scores by State
Source: Social Capital Project
Figure 3: Social Capital Index Scores

Source: Social Capital Project
This relationship between levels of social capital and employment ratios is both positive and statistically significant: as Figure 4 shows, 54.3% of the variation in employment ratios can be attributed to variations in social capital. Social capital seems a good candidate to be one of our “x-factors.”
Figure 4: Social Capital and Employment Ratios

Source: Center of the American Experiment
These observations prompted me to explore three questions. First, what is social capital? Second, how is it related to economic well-being? And third, can policy affect it and if so, how? Stay tuned.
This article is based on our new report “The X-Factor? Social capital and economic well-being: A quantitative analysis.”