How is social capital linked to economic well-being?
Over the last few weeks, I’ve written about how Minnesota and its neighbors have very different economic policies but very similar employment outcomes and how they have similarly high levels of what is called “social capital.” I’ve asked whether higher levels of social capital account for some portion of the high rates of employment and household income seen in Minnesota and its neighboring states. This lead me to seek a quantification of social capital and we can now examine the relationship between social capital and economic well-being.
Investigating the link between social capital and economic well-being
Previous research has generally found positive associations between social capital and drivers of economic well-being. Higher levels of social capital in a community are associated with higher levels of employment and greater ability for entrepreneurs to identify and exploit business opportunities and access financing.
This gives us a hypothesis to test: A higher level of the various components of social capital in an area is associated with higher levels of economic well-being in that location, as measured by median household income. The null hypothesis to be tested is, then, that there is no relationship between levels of the components of social capital and median household income. We use multiple regression analysis to test the null hypothesis, utilizing the Real Statistics Resource Pack software, which is an add-in to Microsoft Excel.
Variables
To this point we have mainly focused on the Social Capital Project’s state index. For our analysis, we will use the county index. This involves some cost in terms of breadth: there are only three sub-indices and one standalone indicator for the county index owing to the lack of some data at the county level. On the other hand, using the county index gives us 2,897 observations as opposed to the 50 the state index does, and the county index is correlated with the state-level index at 0.96 in any event.
Our response (outcome/dependent) variable will be the median household income for each county, which is provided by the Social Capital Project.
To attempt to explain the different levels of median household income, we use four explanatory (factor/independent) variables. These are the sub-indices and stand-alone indicator of the Social Capital Project’s county index. These are:
Family Unity:
…combines county-level data from the American Community Survey (2007-2011 and 2012-2016) on the share of births that are to unwed mothers (weight of 0.52), the percentage of children living in families headed by a single parent (weight=0.62), and the percentage of women ages 35-44 who are married (and not separated) (weight=0.59).
Community Health:
…combines non-religious nonprofits per capita (weight of 0.70), congregations per capita (0.48), and the informal civil society subindex (0.53).
Institutional Health:
…include[s] presidential voting rates (weight of 0.63), census response rates (0.41), and the confidence subindex (0.66)…
Collective Efficacy:
…the violent crime rate was included to reflect the level of collective efficacy in a county. It comes from the Federal Bureau of Investigation’s Uniform Crime Reporting Program.
We remove all counties without an overall index score, without a score in one of the sub-indices or stand-alone measures, and without a value for median household income. This leaves a total of 2,897 counties in our sample.
We also include controls for county size and metropolitan status using the United States Department of Agriculture’s Rural-Urban Continuum Codes for 2013. There are two reasons for this.
First, regarding Collective Efficacy, “Median household income is substantially lower in rural areas than in urban areas,” and “urban areas generally have higher crime rates than suburban or rural areas.” Yet it is unlikely that crime rates are, on average, higher in urban areas because incomes are, on average, higher there, rather it is a function of urbanization itself.
Second, regarding Community Health, of the three indicators which make up this subindex, “Religious congregations p 1,000” is negatively correlated with median household income (-0.43); it is the only one of the 10 indicators behind our four subindexes which has an “unexpected” sign. To dig deeper into this, we calculate correlation coefficients for “Religious congregations per 1,000” with 67 indicators and benchmarks given by the Social Capital Project. While none meet a threshold of 0.70, we do find values above 0.50 for “Membership Organizations p 1,000,” (0.50), “’Associations’ p 1,000, Penn State method,” (0.54), “Non-religious non-profits plus religious congregations p 1,000,” (0.64), and “% rural,” (0.64). The first three of these are measures of “associational life” which we might expect to see correlated reasonably strongly with “Religious congregations p 1,000” which is also a measure of associational life. What is interesting — particularly when we note the value below -0.50 for ‘% rich in block group of ave. rich person” (-0.57) — is the stronger correlation with “% rural.” What this suggests is that “Religious congregations p 1,000” is a measure of social capital associated reasonably strongly with rural areas which have, on average, lower median household incomes (the correlation coefficient between median household income and “% rural” is -0.38).
Results
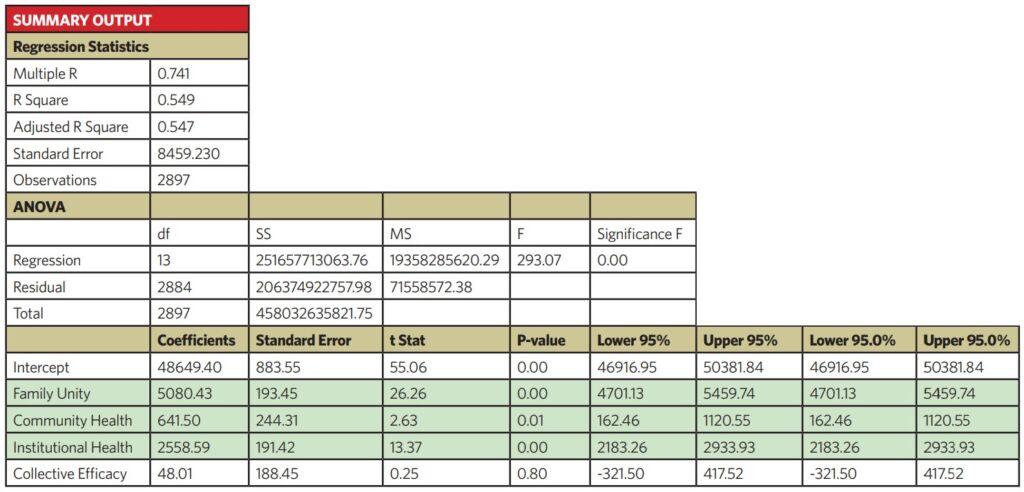
Table 1 shows the results of our multiple panel regression measuring the impact of our four explanatory variables — the components of social capital at the county level — and our controls for county size and metropolitan status on levels of median household income.
Table 1: Multiple Regression Results, County Social Capital Score and Median Household Income
Source: Center of the American Experiment
Significance F tells us whether the model as a whole is statistically significant. In this case, the p-value is less than 0.05, which tells us that there is a less than five percent chance that the null hypothesis is true, which indicates that we can reject it. Our explanatory variables combined have a statistically significant association with levels of median household income.
The R Square value is the proportion of the variance in the response variable — median household income — which can be explained by our explanatory variables. Its value of 0.549 indicates that 54.9 percent of the variation in median household income across our 2,897 observations can be explained by variations in the components of social capital: Family Unity, Community Health, Institutional Health, and Collective Efficacy.
The individual p-values tell us whether each explanatory variable is significant. With a p-value greater than 0.05, we can see that the positive relationship between Collective Efficacy and median household income is not statistically significant. However, for our other three variables — Family Unity, Community Health, and Institutional Health — the relationships with median household income are both positive and statistically significant, with p-values below 0.05.
The Coefficients for each explanatory variable tell us the average expected change in the level of median household income, assuming the other explanatory variables remain constant. For example, for each one-point (1.00) increase in a county’s score on the Family Unity sub-index, the average level of median household income is expected to increase by $5,080 (alternatively, a one Standard Deviation — 0.98 — increase in the Family Unity sub-index score is expected to increase median household income by $4,979). To put that in context, it would mean Family Unity in St. Louis County, Minnesota, rising to the level of Carlton County, Minnesota, and the median household income rising by $5,080.
Discussion
Having established that there are statistically significant relationships between the Family Unity, Community Health, and Institutional Health subindices and median household income, we must address the question of endogeneity: is it the case that higher scores on these subindices are the result of higher median household incomes or is it the other way around?
Institutional Health
It is hard to see how higher levels of Institutional Health, as measured by the Social Capital Project, drive higher median household income.
This variable is derived from three indicators: “Presidential election voting rate, 2012 & 2016,” “Mail-back census response rate,” and a “Confidence in Institutions Subindex.” “Presidential election voting rate, 2012 & 2016” has the strongest — although not very strong — correlation coefficient with median household income (0.38), but it seems to be the case that voter turnout rises with income, not the other way around. Likewise, it is difficult to see how an increase in the “Mail-back census response rate” would boost median household incomes. While greater levels of “trust” are certainly linked with economic development, this is more trust in each other and is not really captured by the “Confidence in Institutions Subindex.”
Community Health
It is easier to see how Community Health, as measured by the Social Capital Project, might drive higher median household income.
This variable is derived from three indicators: “nonreligious nonprofits per capita,” “congregations per capita,” and “the informal civil society subindex.” As measures of “associational life,” the subjects of these indicators have long been at the heart of research and discussion relating to social capital. The research cited above, which found links between higher levels of social capital in a community and higher levels of employment and greater ability for entrepreneurs to identify and exploit business opportunities and access financing, identified “network size,” “kin and close neighbors,” “engagement in a range of social activities,” and “friendship networks” — “Bonds” and “Bridges” captured in the “informal civil society sub-index” — as the avenues through which this is actuated.
Family Unity
It is easiest to see how higher levels of Family Unity, as measured by the Social Capital Project, could drive higher median household income. Indeed, the coefficient in Table 2 is larger for Family Unity than for any other variable.
For one thing, if there are more people in a household working to earn income, we could expect that household, on average, to have a higher income. Indeed, Kearney notes that while the median household income for families where the mother had a four-year college degree increased by 55 percent between 1979 and 2018, it fell by 4 percent for families where the mother had “high school/ some college” and by 20 percent for those where the mother had “less than high school.” “Why?” she asks:
Because the earnings gains for mothers in these education groups were offset by an increased likelihood of not having a spouse or partner — and hence another potential earner — in their household. The decrease in the share of households headed by two parents — a fall from 81% to 67% for moms with a high school degree and from 79% to 66% for moms without a high school degree — led to a decrease in median household earnings for mothers without a college degree. These numbers show that the college gap in family structure has been a meaningful contributor to the rise in household earnings inequality.
The correlation coefficients for “% women currently married” are negative for both “% with debt in collection,” (0.53) and “Poverty rate” (0.54). The decline in marriage and rise in single parenthood in recent decades has been steepest among minority communities — except for Asian Americans — and we see that the correlation coefficient for “% women currently married” is negative (-0.57) for “% black” and that the correlation coefficient for “% children with single parent” is negative for “% non-Hispanic white” (-0.52) and positive for “% black” (0.65).
Overall, these results confirm our hypothesis. There is a positive and statistically significant relationship between the levels of the Family Unity, Community Health, and Institutional Health components of social capital and levels of economic well-being. Hitherto, results from the research into the relationship between levels of social capital and economic well-being at the macro-level have been, according to Field, “suggestive rather than conclusive.” Partly this is a result of the poor quality of evidence stemming, in turn and in part, from the difficulties of quantifying social capital: if this is a difficult task in a developed economy like the United States, it is much more challenging in less developed countries. Our results make the case that higher levels of social capital are associated with greater economic well-being at the macro-level less suggestive and more conclusive.
This article is based on our new report “The X-Factor? Social capital and economic well-being: A quantitative analysis.”