Is the ‘positivity rate’ a good Covid-19 benchmark?
As I wrote over the weekend:
When he closed Minnesota’s bars and restaurants on March 16, Gov. Walz said, “We’re not going to stop this from spreading, but we can stop how fast it spreads and we can make sure that we protect those most vulnerable.” When he issued a stay-at-home order on March 25, he said: “The objective of everything we’re doing here is, it’s too late to flatten the curve as we talked about, the testing regimen was not in place soon enough for us to be able to do that, or expand it enough. So what our objective is now is to move the infection rate out, slow it down, and buy time so that the resources of the ICU and the hospitals and the things that we’re going to talk about today can be stood up to address that.”
The point of the closures and the stay-at-home order was not to kill the coronavirus but to slow its spread so that the health system’s ability to cope would not be overwhelmed: “The thing that Minnesota is going to do is ensure if you need an ICU, it’s there,” Gov. Walz explained.
…
So, it was good news on April 29 when Gov. Walz announced: “I today can comfortably tell you that, when we hit our peak — and it’s still projected to be about a month away — if you need an ICU bed and you need a ventilator, you will get it in Minnesota.” When Version 3 was unveiled on May 13 and forecast a peak ICU usage of 3,397 on June 29, the state was equipped to handle it.
…
The disaster in our state’s care homes apart…the aim of the stay-at-home order of March 25 was achieved: Our health system has had more than adequate capacity to handle all COVID-19 cases needing ICU care.
And yet, 25 weeks later, Gov. Walz clings on to his emergency powers. What will it take for him to give them up?
Last week the Star Tribune reported:
Six months after issuing the emergency order, Walz said he is looking for declines in both the positivity rate of COVID-19 diagnostic testing and the rate of infections that can’t be traced to community sources.
“If we could get community spread under 20%, and we could get the test positivity rate under 4, you’ve got a really good chance of doing most things,” Walz said in an interview at the half-year milepost of his pandemic response.
But do those measures make sense as benchmarks?
Take the positivity rate, the share of Covid-19 tests which come back positive. This is largely driven by how testing is conducted. As Figure 1 shows, between April 4th and 28th, the seven day moving average positivity rate shot up from 5.1% to 19.0%. Over this period, an average of 1,755 tests were conducted daily. With fewer resources available for testing, we prioritized those with symptoms who were more likely than the average Minnesotan to be infected with Covid-19. This was sensible medical practice, but it does mean that our sample was not ‘random’: these numbers tell us nothing about how prevalent the disease actually was among Minnesota’s population. As our capacity to test has increased – the number of tests conducted daily in the seven days to September 12th averaged 14,463 – we have tested more people who are less likely to be infected, our sample has become more ‘random’, and our positivity rate has come down. It has plateaued since mid-July at an average of 5.0%.
Figure 1: Covid-19 tests conducted and share of tests positive in Minnesota
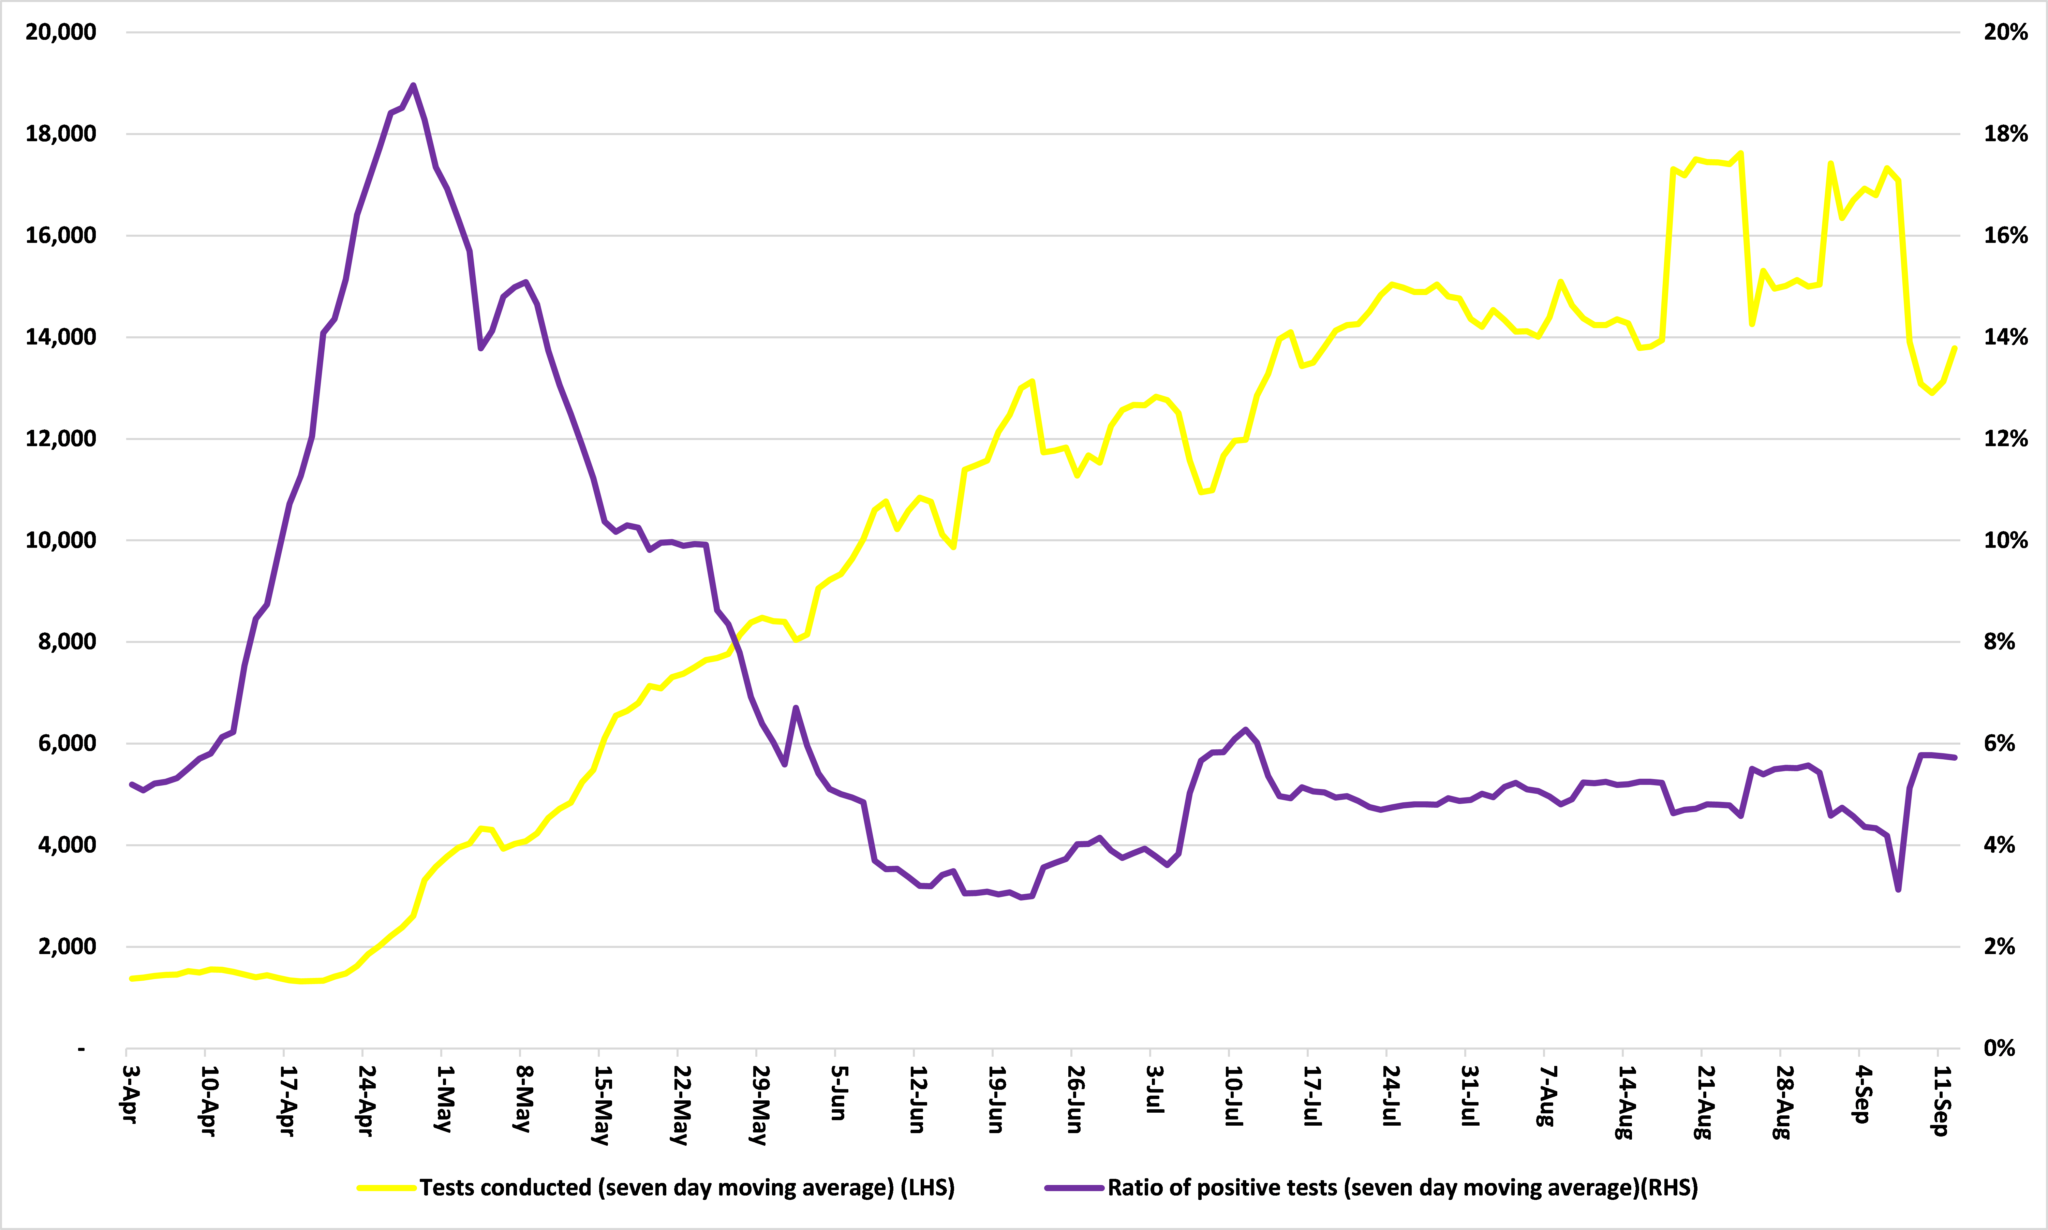
Source: Minnesota Department of Health
This is a welcome development. As I wrote in May:
Until now, we have focused testing on identifying whether people who appear to be infected actually are. Given limited resources, this makes sense. But as we increase testing capacity, we can test random samples of the population, like an opinion poll, and this would start to give us some idea of what Covid-19’s IFR is.
It would also give us a good idea of how prevalent the disease actually is among Minnesota’s population.
But it is not clear that Minnesota’s Covid-19 is being done on that basis. For example, people are more likely to go to walk in testing centers if they suspect they are infected with Covid-19, say because they have symptoms, and these people are more likely to be infected. It follows that the sample will not be truly ‘random’ and the results skewed towards positive tests. The positivity rate will be higher than it actually is for the community at large.
As long as testing is not truly ‘random’, the positivity rate is an unreliable benchmark.
John Phelan is an economist at the Center of the American Experiment.