Is the share of cases coming from ‘community spread’ a useful benchmark for Gov. Walz’ emergency powers?
On Monday, I wrote about the new benchmarks Gov. Walz has set for him to relinquish the emergency powers he has held since March. The Star Tribune reported:
Six months after issuing the emergency order, Walz said he is looking for declines in both the positivity rate of COVID-19 diagnostic testing and the rate of infections that can’t be traced to community sources.
“If we could get community spread under 20%, and we could get the test positivity rate under 4, you’ve got a really good chance of doing most things,” Walz said in an interview at the half-year milepost of his pandemic response.
As of Thursday, the rate of cases from unknown community transmission was 35%, an indicator that the virus is spreading beyond the state’s ability to track it.
Regarding the the positivity rate, I wrote that as long as testing is not truly ‘random’ it is an unreliable benchmark. But what of ‘community spread’?
It seems curious to make the ratio of ‘community spread’ cases to all cases a particular benchmark. To calculate it, you divide the number of ‘community spread’ cases – the numerator – by the total number of cases – the denominator. But the result of this calculation is driven as much by the denominator as it is by the numerator: a rise/fall in the number of cases identified in, say, congregate care homes, will act to lower/raise the share of cases attributable to ‘community spread’ even if the number of such cases remains constant.
There are also reasons to believe that the number of community cases isn’t an especially useful guide. Data from the Department of Health’s weekly Covid-19 reports, shown in Figure 1, indicates that, since mid-June at least, the growth rate of cases from ‘community spread’ generally matches the growth rate of cases overall pretty closely.*
Figure 1: Weekly growth in all cases and ‘community spread’ cases of Covid-19 in Minnesota
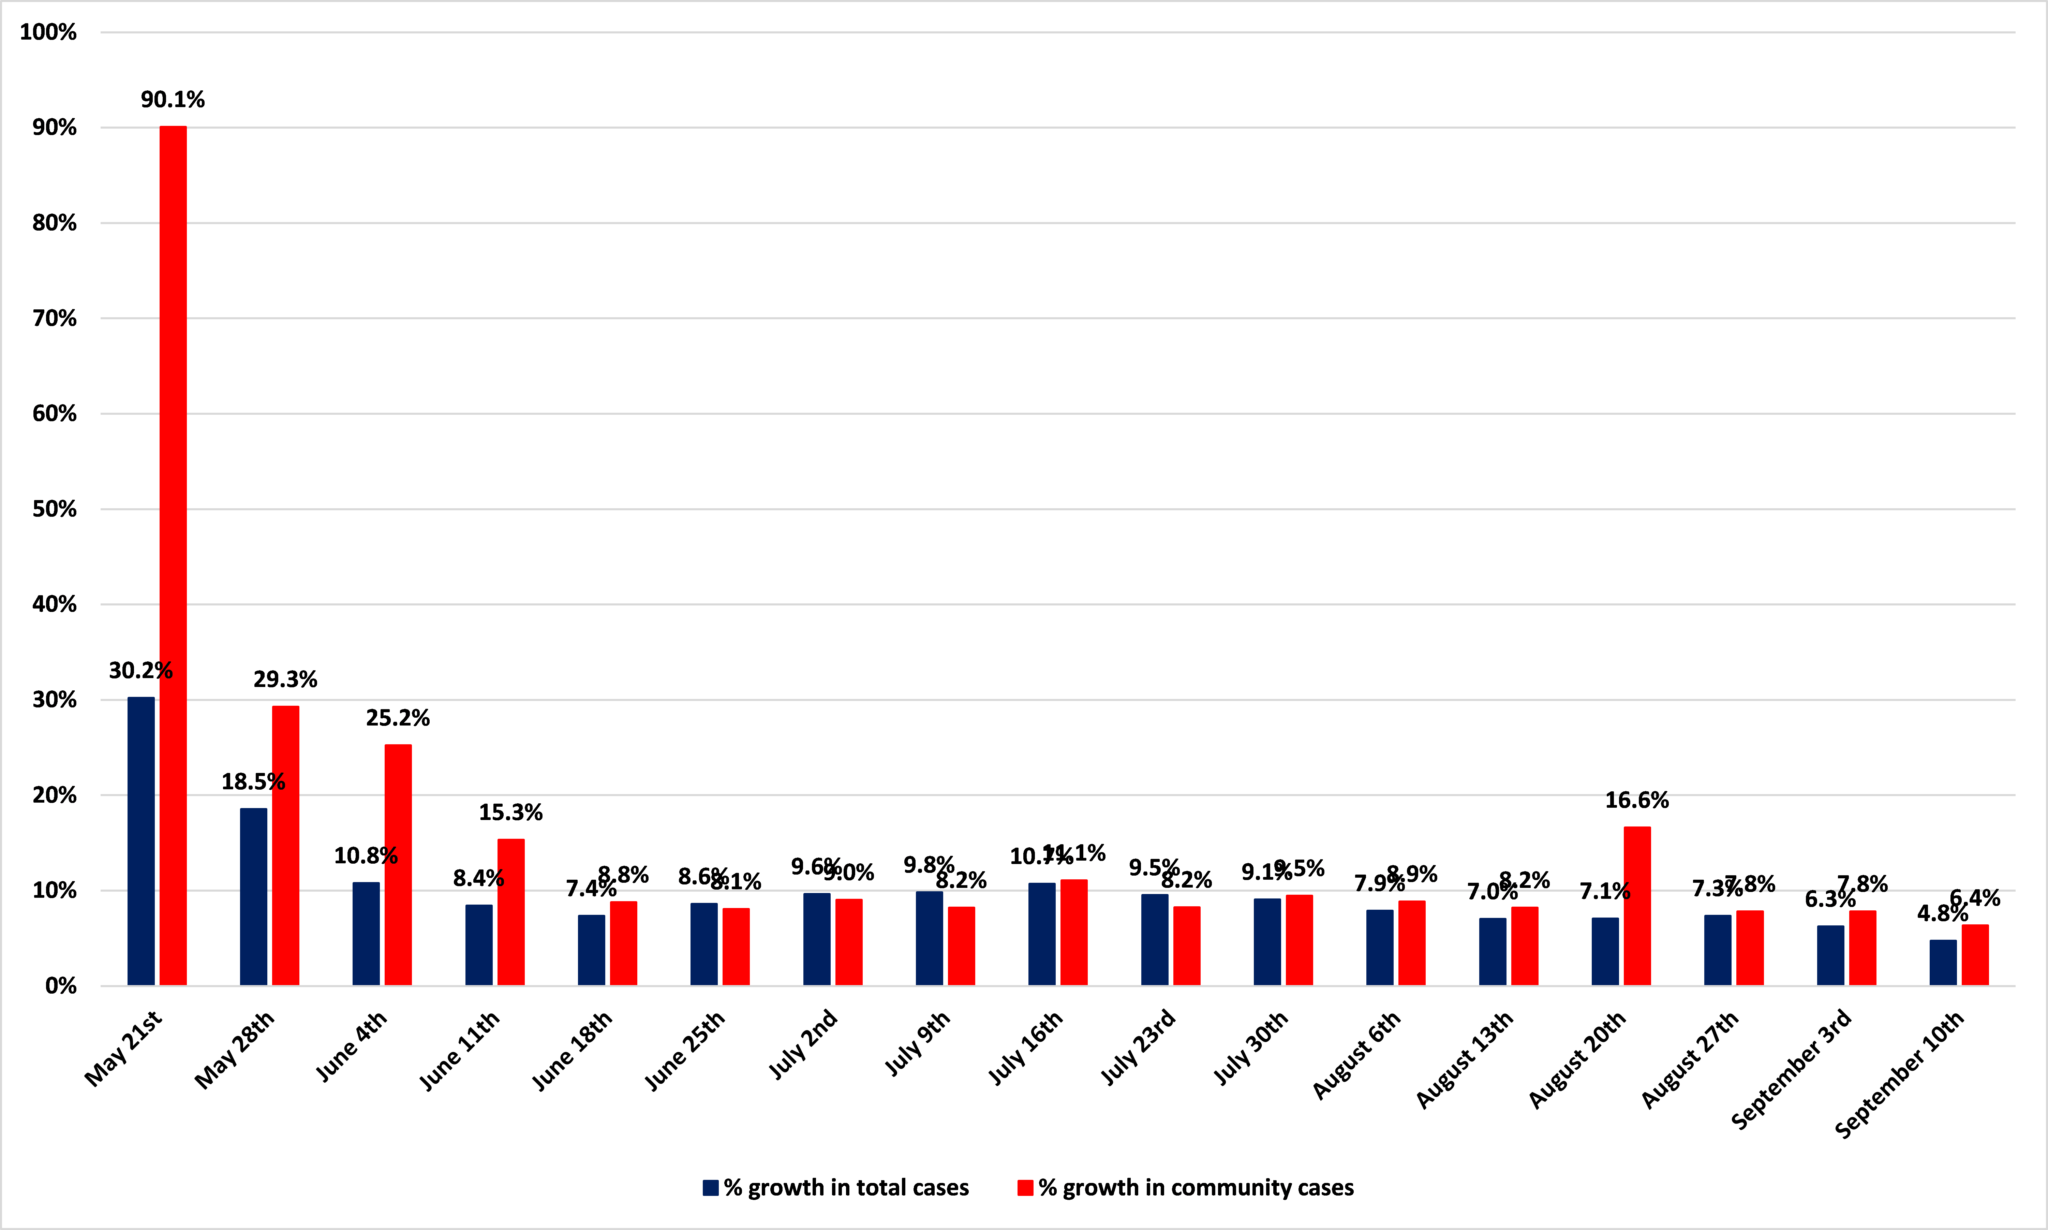
Source: Minnesota Department of Health
Figure 2 shows what share of all cases have been community spread cases. From early June to mid-August it was fairly stable at between 51 and 53%. Since then it has jumped to 58%.
Figure 2: Community spread cases as a share of all Covid-19 cases in Minnesota
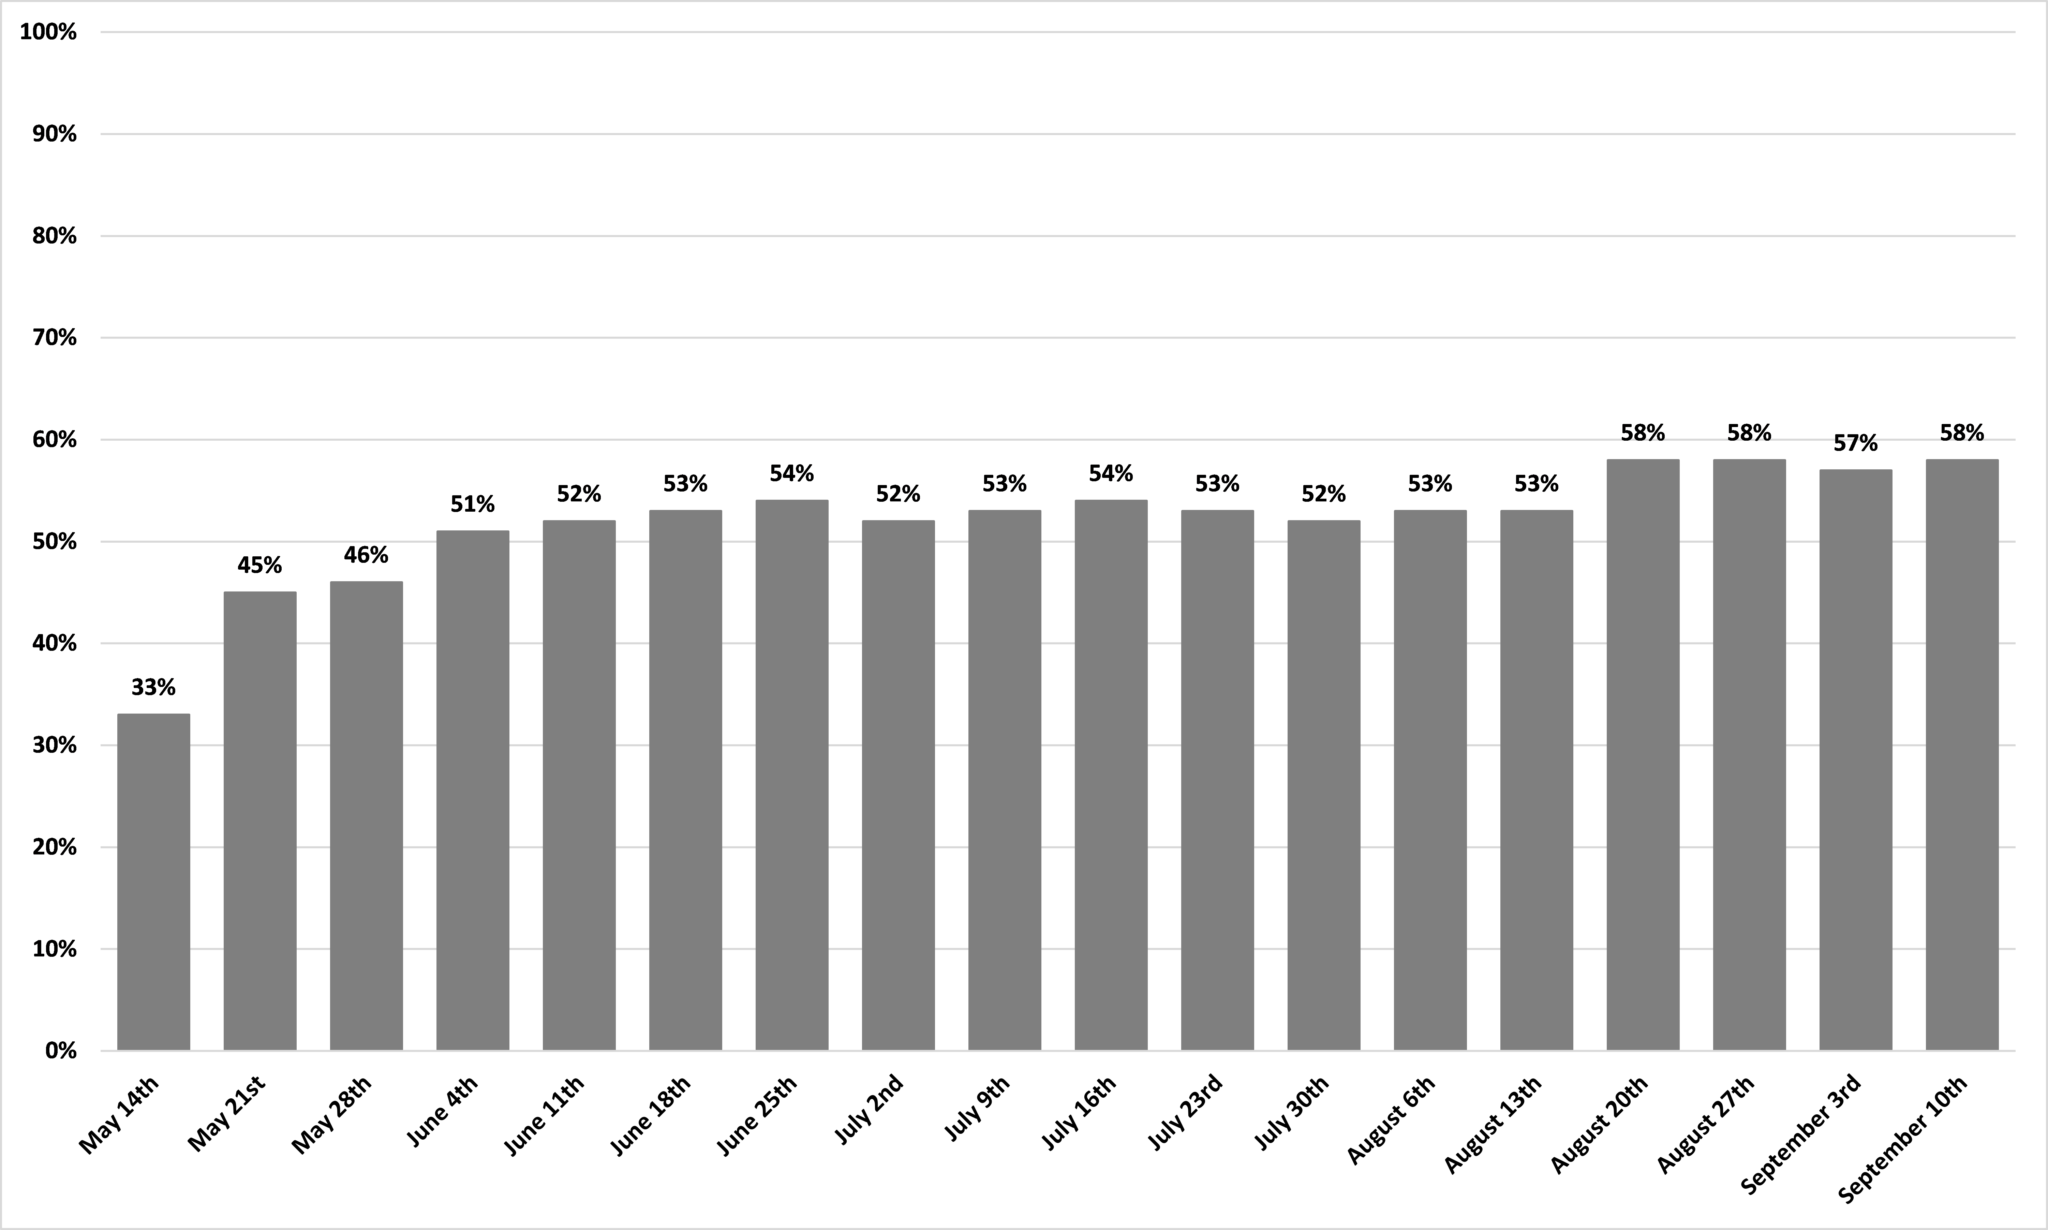
Source: Minnesota Department of Health
But, as Figure 3 shows, this rise in the share of community spread cases has lead to no great increase in hospitalizations in Minnesota for Covid-19, certainly not for all important ICU hospitalizations. And, as Figure 4 shows, neither has there been a surge in deaths, most of which continue to occur in the state’s care homes.
Figure 3: Covid-19 hospitalizations in Minnesota
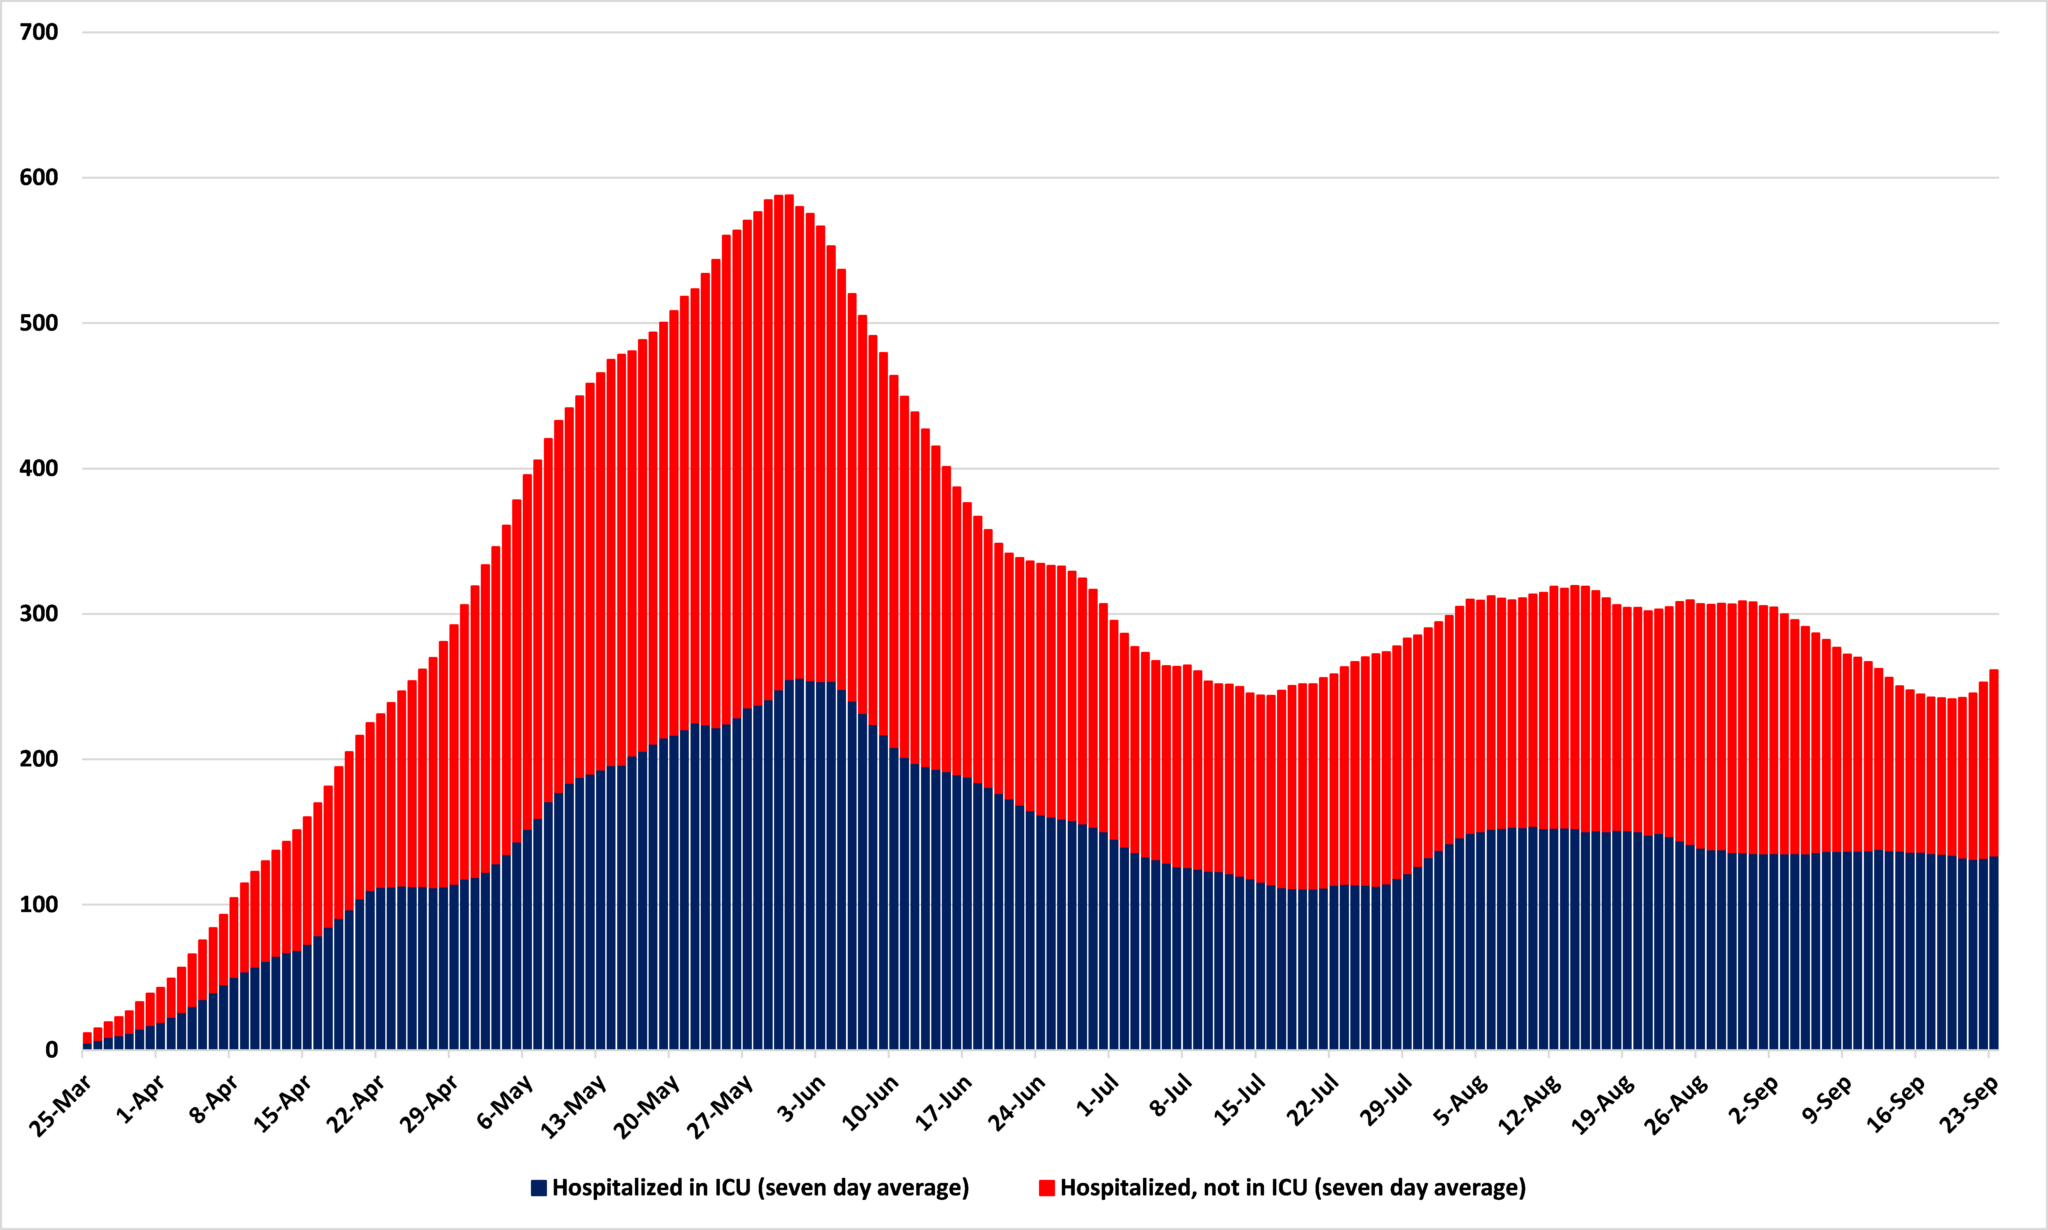
Source: Minnesota Department of Health
Figure 4: Daily Covid-19 deaths, seven day moving average
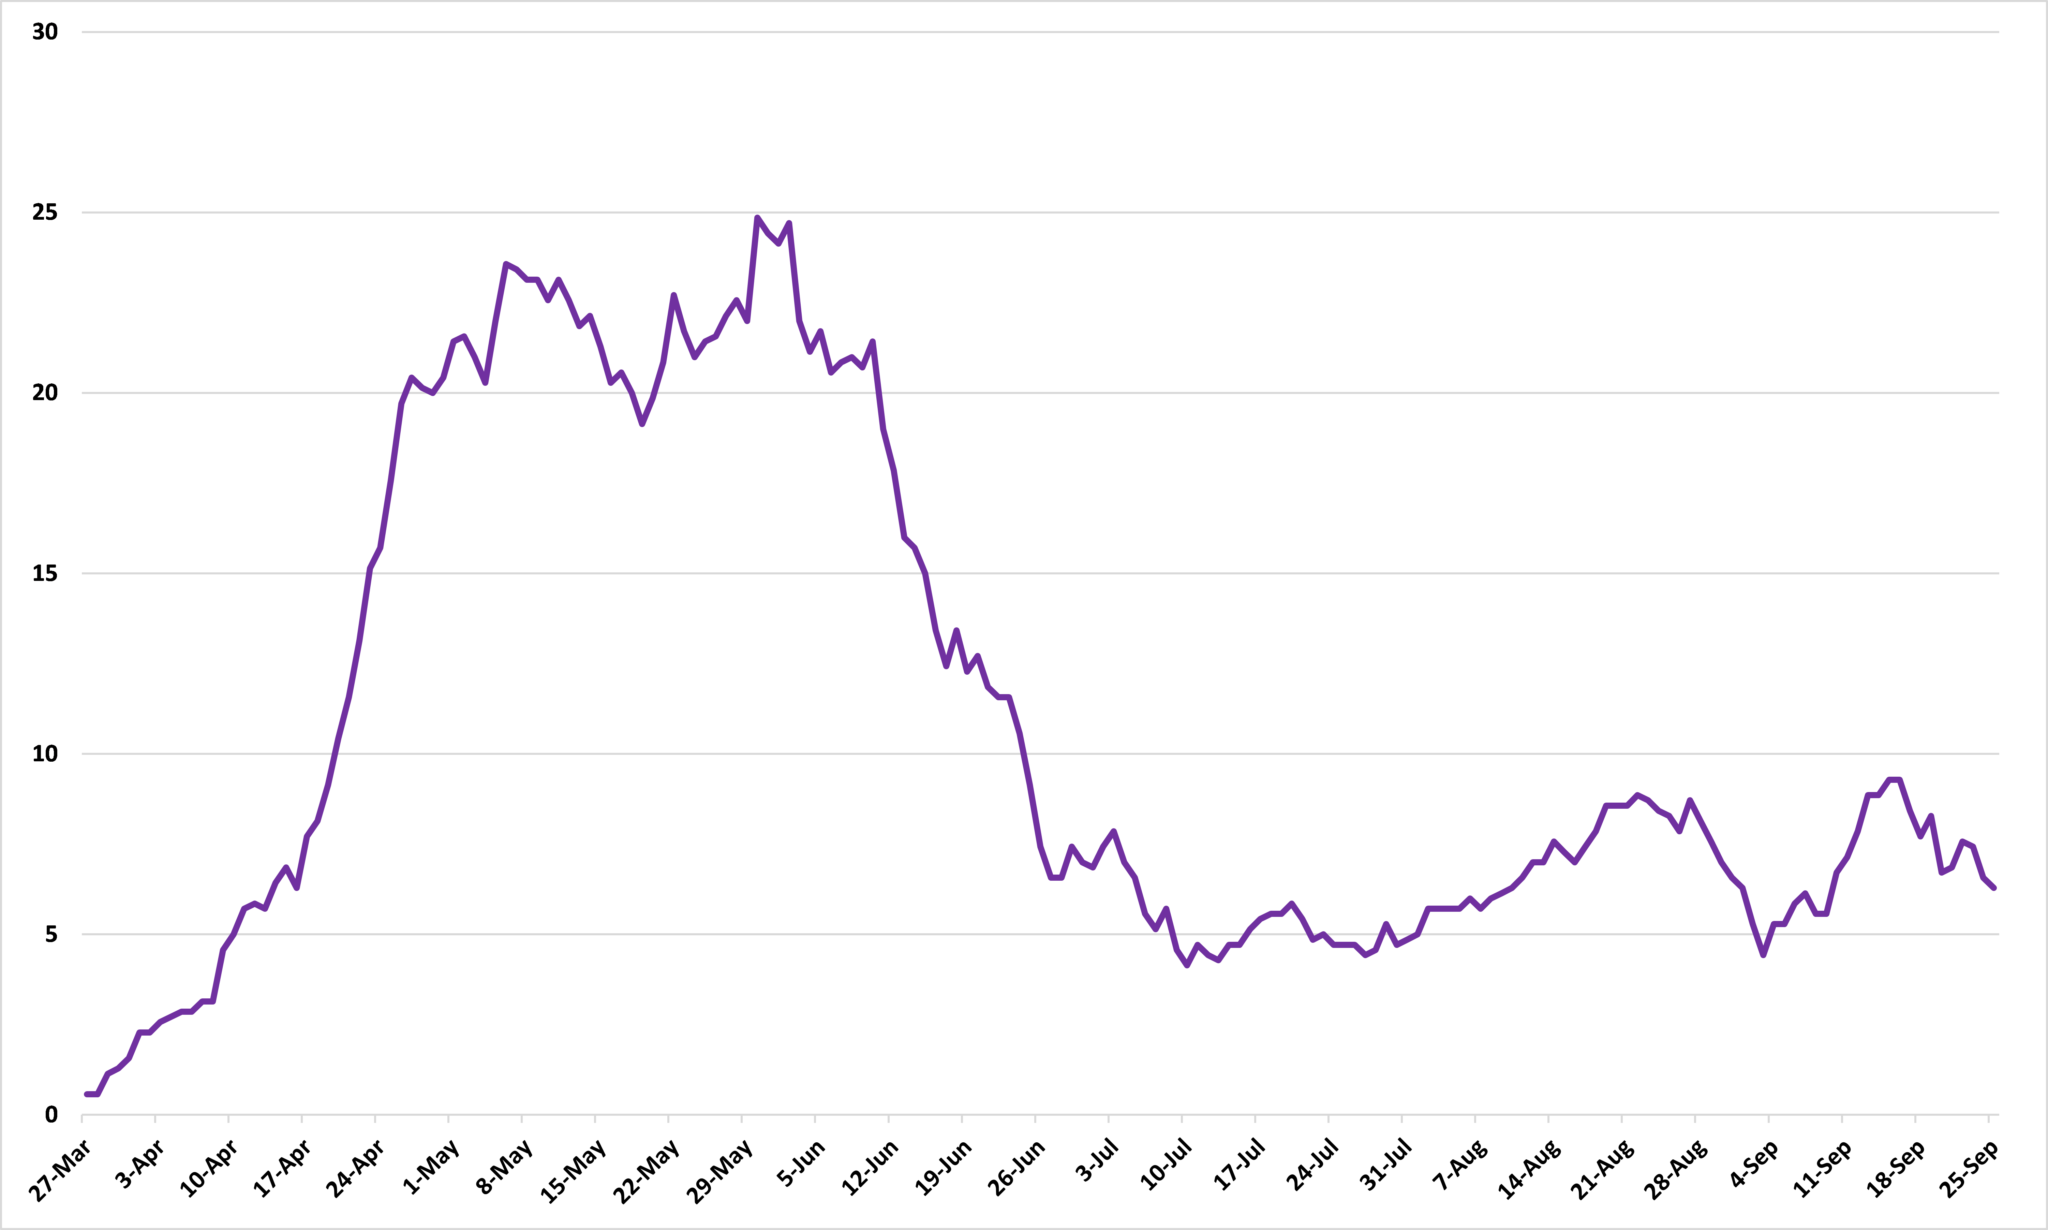
Source: Minnesota Department of Health
All of this is useful data and the more that is available the better, which makes yesterday’s decision to stop releasing data on hospitalizations a scandal. But, as with the positivity rate, it isn’t clear that the ratio of community spread cases makes a very useful benchmark for whether Minnesota is in a state of emergency or not.
*’Community (known contact with confirmed case)’ and ‘Community (no known contact with confirmed case)’ prior to w/e June 25th, ‘Community (outbreak)’, ‘Community (known contact with confirmed case)’, and ‘Community (no known contact with confirmed case)’ subsequently.
John Phelan is an economist at the Center of the American Experiment.