Minnesota’s employment ratio has fallen from 4th to 7th highest since 2019
Over the last couple of weeks, I’ve written about how Minnesota and its neighbors have very different economic policies but very similar employment outcomes and how they do have similarly high levels of what is called “social capital.”
In making the latter point yesterday, however, something struck me. Below is a modified version of yesterday’s Figure 1 which shows each state’s Tax Foundation State Business Tax ranking going back ten years (the red lines) and their employment ratio, the share of the population actually employed (the green lines). In today’s version our state’s employment ratio is highlighted in purple and we see that Minnesota’s employment ratio has dropped from 4th highest in 2019 to 7th highest in 2022.
Figure 1: State economic policy and employment outcomes
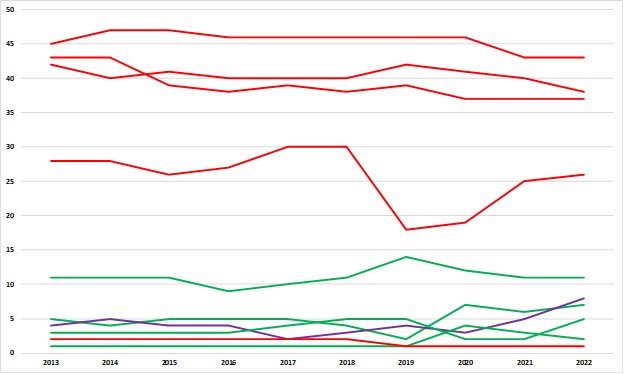
Source: Bureau of Labor Statistics and the Tax Foundation
Figure 2 puts this in context. Using data from the Bureau of Labor Statistics, it shows that Minnesota’s employment ratio fell by 1.3 percentage points from 2019 to 2022, a steeper fall than in 32 out of 50 states.
Figure 2: Percentage point decline in employment ratio, 2019 to 2022
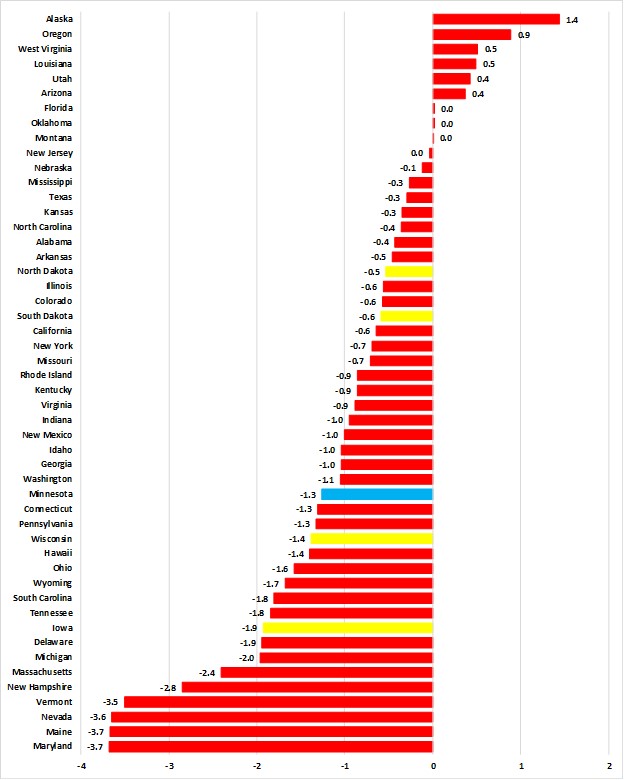
Source: Bureau of Labor Statistics
What is driving this? I looked into this last year:
Figure [3] shows the percentage point change in the employment ratio (the share of a given component actually employed) from 2019 to 2022. We see that the overall employment ratio is down by 1.3% over the period, which is what we’d expect to see given that Minnesota is one of only 13 states not to have regained its pre-pandemic number of private sector jobs.
Figure [3]: Percentage point change in employment ratio, 2019 to 2022
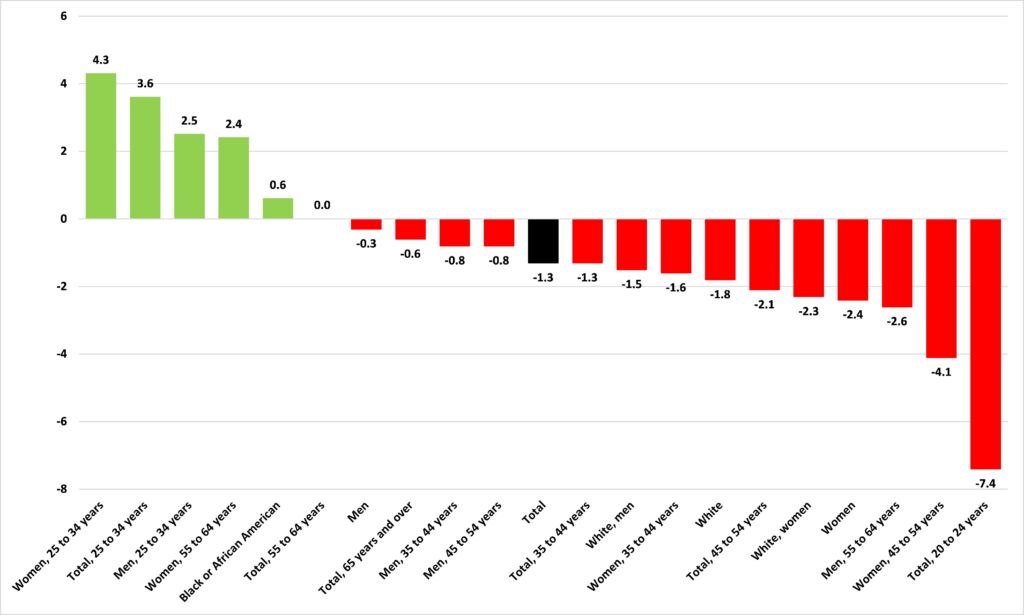
But look at the components. On the left, in green, are those where the employment ratio increased between 2019 and 2022, with ‘Women, 25 to 34 years’ leading the way with an increase of 4.3 percentage points in their employment ratio. But over on the right, in red, we see that the component of Minnesota’s labor force with the steepest fall in its employment ratio is ‘Total, 20 to 24 years,’ whose employment ratio fell by 7.4 percentage points from 2019 to 2022. These are younger Minnesotans, who should be accumulating skills and entering the prime of their working lives. In reality, the number of 20- to 24-year-old Minnesotans not in the labor force increased by 25,000 between 2019 and 2022, a 41% increase, which was the largest of any of these components.
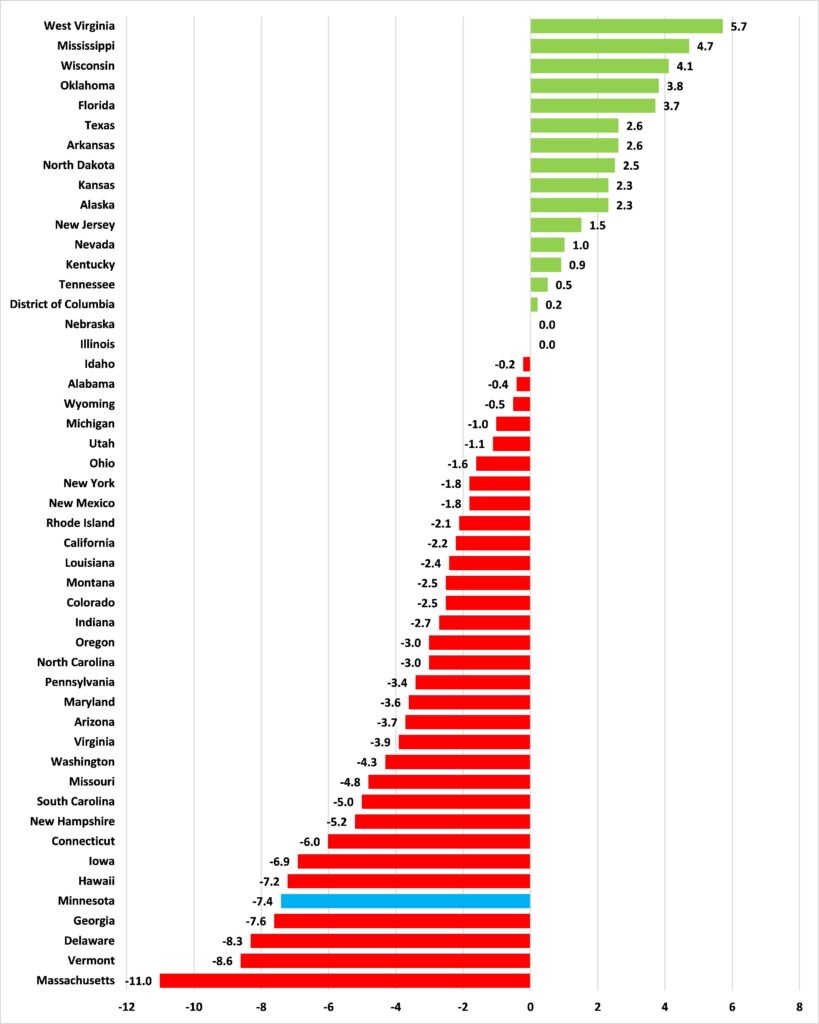
To put this in context, Figure [4] shows the percentage point change in the employment ratio for 20- to 24-year-olds for 49 states and the District of Columbia (Maine’s numbers for 2022 aren’t in) between 2019 and 2022. Fourteen states — including Ron DeSantis’ Florida — and the District of Columbia have seen their employment ratio for 20- to 24-year-olds increase from 2019 to 2022. Not only is Minnesota one of the 32 states that saw its employment ratio for 20- to 24-year-olds fall from 2019 to 2022, its fall — 7.4 percentage points — was the fifth worst in the United States.
Figure [4]: Percentage point change in employment ratio, 20- to 24-year-olds, 2019 to 2022
My report “The X-Factor? Social capital and economic well-being: A quantitative analysis” argues that there are other factors, including, possibly, social capital, which drive state employment ratios. If so, states with high levels of social capital might be cushioned from the negative effects of bad state economic policy. But only for a time. Like any capital, stocks of social capital can be run down.