Minnesota’s high taxes are not buying us a better quality of life
This week, I’ve written about the body of empirical research which shows that people leave and avoid high tax states and about our own research which shows that Minnesota’s taxes are influencing out-migration from our state.
Often, when I point this out, people say that Minnesota’s high taxes are the price we pay to make it a great place to live. Indeed, Minnesota does rank highly when it comes to quality of life: U.S. News & World Report’s annual Best States Rankings typically have us up near the top, we ranked 2nd in 2021.
But is that really because of Minnesota’s high taxes or is something — or things — else responsible? If high taxes really make our state a great place to live, we would see a positive relationship between state tax burdens and quality of life rankings (assuming the latter are constructed sensibly). Sadly, the data do not show this.
No relationship in the data between higher taxes and better quality of life
Figure 1 shows the relationship between a ranking of state tax burdens for 2019 (Figure 2 in our new report, ‘Taxes and Migration Minnesotans on the Move to Lower Tax States’) and their ranking on that year’s Best States Rankings. We see no causal relationship: in other words, higher tax burdens do not improve your state’s Best States ranking.*
Figure 1: Tax burdens and Best States Rankings
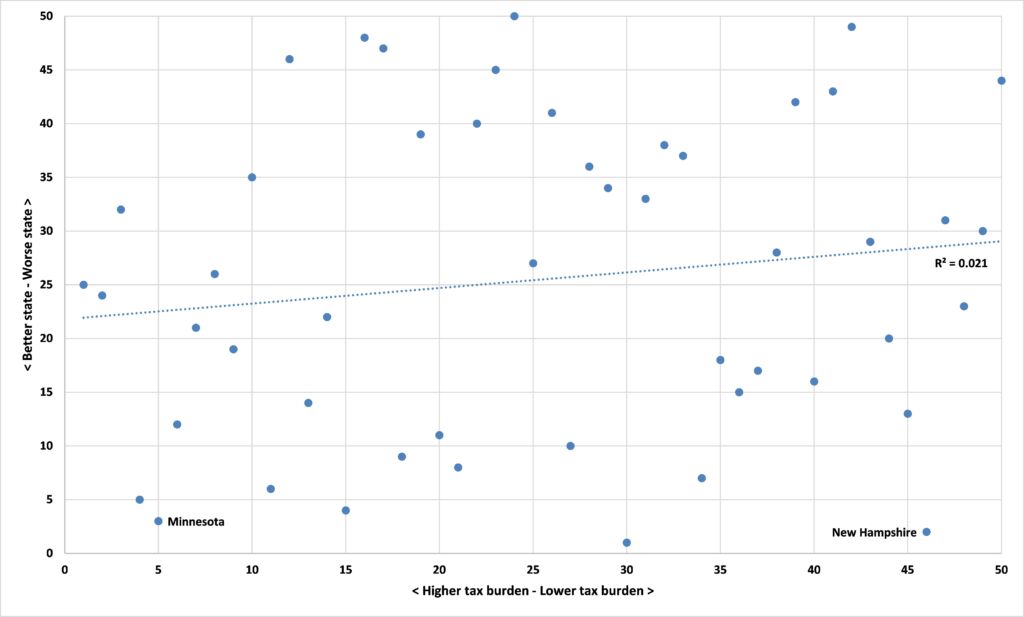
Source: Center of the American Experiment
This chart is a good advertisement for the use of data over anecdote. Minnesota, for example, has both a high tax burden and a high Best States ranking and some, as I’ve noted, use this as an argument in favor of our state’s high taxes. But New Hampshire has a much lower tax burden and a higher Best States ranking than we do. Which of these anecdotes tells us the truth about the relationship between tax burdens and quality of life? The answer is neither of them. We have to take them together. Doing so tells us, as we’ve seen, that, whatever it might be that we get for our high taxes, a better quality of life is not one of them.
*The p-values are a hefty 50 percent with the one-tail test and 100 percent with the two-tailed test. Any relationship with a p-value above 5 percent is seen as statistically insignificant.