Minnesota’s post COVID-19 job recovery is weak
Today, Minnesota’s Department of Employment and Economic Development released unemployment numbers for March. The headline was that the our state’s seasonally adjusted unemployment rate ticked down from 4.5% in February to 4.2% last month.
But the unemployment rate can be a slightly misleading statistic. It is calculated by dividing the number of people who are out of work and looking for work by the number of people in the labor force. But not all of Minnesota’s ‘Civilian Noninstitutional Population’ (CNP) is included in the labor force. Minnesotans who are unemployed and not looking, for example, drift out of the unemployment rate and into a sort of statistical limbo. To get a truer picture of unemployment, we ought to divided the number of Minnesotans who are part of the CNP but aren’t part of the labor force by the number of people in the CNP.
Figure 1 shows this true unemployment rate for Minnesota and the United States from January 2020 to March 2021. We see that the rate in Minnesota is consistently below the rate for the United States generally. We also see the surge in unemployment in April last year, where the true unemployment rate went from 32.3% to 38.3% in a month in Minnesota. We see the decline in the rate from 38.4% in May to 34.9% in June.
What is concerning, however, is that there has been no further decline since then. Indeed, while the United States’ rate has continued to drift down, from 45.4% in June 2020 to 42.2% in March 2021, the rate in Minnesota has actually drifted up, from 34.9% to 35.1%. This might not sound like much, but it is about 9,000 Minnesotans more unemployed in March 2021 than if the rate had held at the 34.9% of June 2020.
Figure 1: Share of the Civilian Noninstitutional Population not in the labor force, %
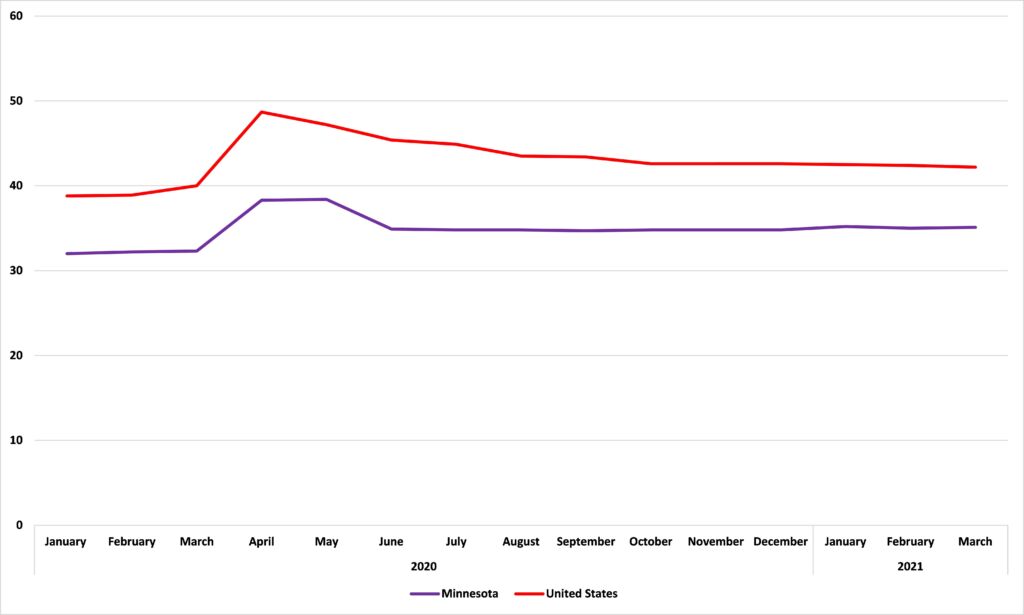
Source: Minnesota Department of Employment and Economic Development
This is a result of sluggish job growth. Today’s release is based on data from the Bureau of Labor Statistics’ Current Employment Statistics (CES) and Local Area Unemployment Statistics (LAUS). Both give numbers for employment which, unhelpfully, don’t quite match up. Figure 2 shows Minnesota’s numbers from both. The pattern is similar in both series. We see the sharp dip in employment from March to April 2020 and a recovery from May to June 2020. After that the picture diverges a little. The LAUS shows no employment growth since May 2020 – nearly a year. The CES show a recovery of decreasing vitality from April to October 2020, a slump from October to December, and finally a return to growth from January 2021.
Figure 2: Employment in Minnesota
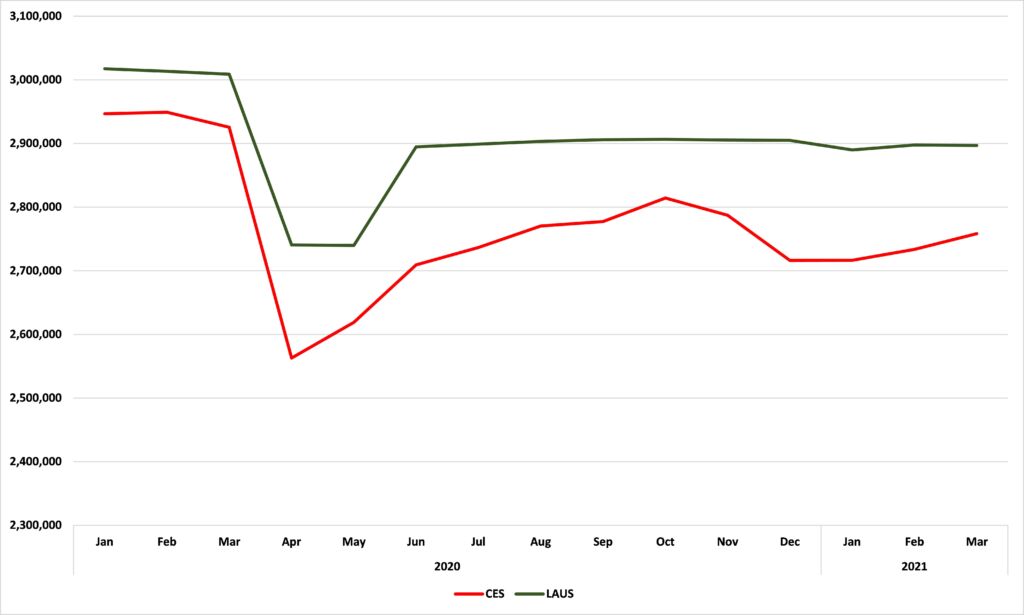
Source: Minnesota Department of Employment and Economic Development
The differences are down to survey methodology. I think the CES numbers are more sensitive and are capturing, in that slump late in 2020, the employment effects of Gov. Walz’ last ‘dial back’ of his infamous knobs.
What this shows, I think, is that the problem facing the economy is not a demand side one which can be solved by giving more money to spend with ‘stimulus checks.’ Instead, it is a supply side problem, with the restrictions preventing the economy from producing as many goods and services as it could. The solution is do what it takes to get those restrictions lifted. Just dumping more money into an economy when capacity is being suppressed will just lead to inflation.
John Phelan is an economist at the Center of the American Experiment.