Minnesota’s labor force decline driven by people in the prime of their working lives
Minnesota’s unemployment rate has fallen in recent months, but this is entirely due to Minnesotans leaving the labor force. Our state actually ranks 8th in the United States for the loss of people from the labor force. What is driving this?
To begin with, the Bureau of Labor Statistics (BLS) calculates a number for the Civilian non-institutional population. This is defined as “persons 16 years of age and older…who are not inmates of institutions (e.g., penal and mental facilities, homes for the aged), and who are not on active duty in the Armed Forces.” This number is then divided between those who are in the labor force and those who are not. If you are either employed or unemployed and looking for work, you are counted in the labor force. If you are unemployed and not looking for work, you are not.
It is the growth in this last category — what might be called true unemployment — that has driven the fall in Minnesota’s unemployment rate. Annual data from the BLS’ Local Area Unemployment Statistics allow us to drill down deeper into this number.*
Subtracting the figure for the labor force from the figure for the Civilian non-institutional population gives us a number for this true unemployment for a range of demographic groups. Comparing 2019 with 2021 shows us how this true unemployment has changed for different demographic groups over the course of the COVID-19 pandemic.
Table 1 shows that from 2019 to 2021, the total number for true unemployment in Minnesota rose by 121,000, an increase of 9.1 percent or 2.4 percentage points in the rate of true unemployment.
Table 1: Change in true unemployment in Minnesota by population group, 2019 to 2021
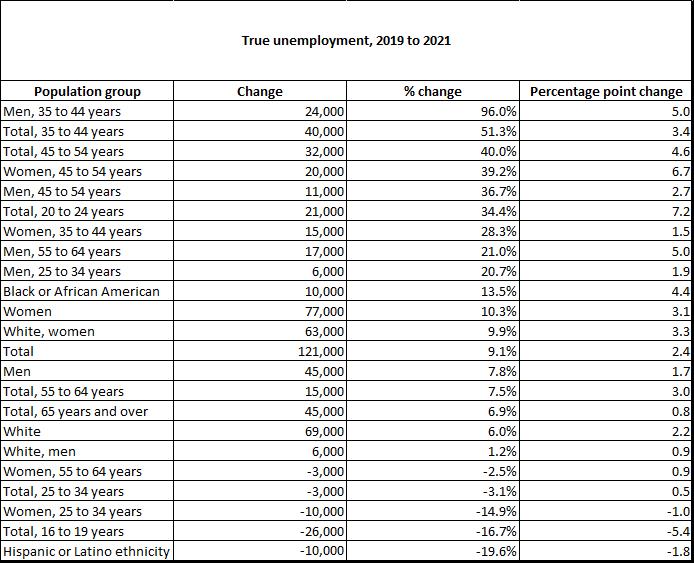
A popular explanation for this increase — which is simply the inverse of a decline in the Labor Force Participation rate — is that older workers dropped out of the workforce when COVID-19 hit and haven’t gone back. Table 1 shows that that is only part of the story. True unemployment for workers over 65 has risen by 45,000, but the overall rate of true unemployment among this group has only changed by 0.8 percentage points. This is because the population group itself has grown as the population ages — and employment has grown also. If we look at younger age groups — 20-24, 35-44, 45-54, and 55-64 — we see much steeper increases in the rate of true unemployment: 7.2, 3.4, 4.6, and 3.0 percent, respectively.
Indeed, to see which population groups have driven this increase in true unemployment, we have to look at where the steepest increases in the rate have come. The four groups where the rate of true unemployment increased by at least 5.0 percentage points from 2019 to 2021 are ‘Men, 35 to 44 years (5.0 percentage points), ‘Men, 55 to 64 years (5.0), ‘Women, 45 to 54 years (6.7), and ‘Total, 20 to 24 years (7.2). Together, these groups of people in the prime of their working lives account for an increase in true unemployment of 82,000, or 67.8 percent of the total.
That popular explanation for declining Labor Force Participation rates — that it is driven by older workers finally retiring — suggests that it is a phenomenon we just have to live with. But this closer look at the data shows the real driver of falling participation rates in the last couple of years has been, in fact, workers in the prime of their working lives. This is encouraging; we can expect them to be working for some years yet. But only if we can get them back into the labor force. That is one of our state’s biggest economic policy challenges.
*Strictly speaking, true unemployment would be this number plus those who are unemployed and looking for work. However, as we are trying to examine the drivers of a fall in the participation rate, I don’t do that here. The numbers aren’t much different in any case.