The share of the state’s ICU beds in use is the correct benchmark for Gov. Walz’ Covid-19 emergency measures
Yesterday, I wrote about some of the bad ideas that have been offered as benchmarks for the ending of Gov. Walz’ personal rule of Minnesota. So, what might be a good idea?
We should start by saying that Gov. Walz was largely correct when he said, on March 16th, “We’re not going to stop this from spreading.” At that time, Minnesota had recorded 179 cases of Covid-19. If state health officials were correct and there were, as they suggested in May, 100 unconfirmed infections in the state for every one lab-confirmed case, then, even at that early stage, nearly 18,000 Minnesotans were infected, many without knowing it. Could we have identified all of them? If we did, could we have traced all their contacts? If we could, would we have been able to quarantine them all? To ask the question is to answer it. By the time the state government was able to react, the horse had bolted.
Given that it was already too late to stop the spread of Covid-19, the obvious right thing to do was ensure that the consequences of this spread could be dealt with. Indeed, I think Gov. Walz made the right call in March:
When he issued a stay-at-home order on March 25, he said: “The objective of everything we’re doing here is, it’s too late to flatten the curve as we talked about, the testing regimen was not in place soon enough for us to be able to do that, or expand it enough. So what our objective is now is to move the infection rate out, slow it down, and buy time so that the resources of the ICU and the hospitals and the things that we’re going to talk about today can be stood up to address that.”
The point of the closures and the stay-at-home order was not to kill the coronavirus but to slow its spread so that the health system’s ability to cope would not be overwhelmed: “The thing that Minnesota is going to do is ensure if you need an ICU, it’s there,” Gov. Walz explained.
This remains, I think, the correct focus of state policy. The disease continues to spread: as of September 27th, 97,638 cases had been identified in the state. If, as the CDC estimated in July, ten times more Minnesotans have been infected with Covid-19 than we know of, we are looking at 980,000 infections. This is well beyond the ability of testing, tracing, and isolating to cope with. What we must ensure, just like back in March, is that our state’s healthcare system has the capacity to cope with the acute cases.
Sadly, monitoring this has become harder. Sadly, Last week Minnesota’s Department of Health (MDH) announced that it was going to stop reporting the number of people in hospital with Covid-19. Keeping track of these numbers, what Gov. Walz told us back in March when we embarked on this costly program of emergency powers, closures, shutdowns and all the rest was the sole end and purpose of it all, has been made more difficult by the MDH’s decision. They should reverse it.
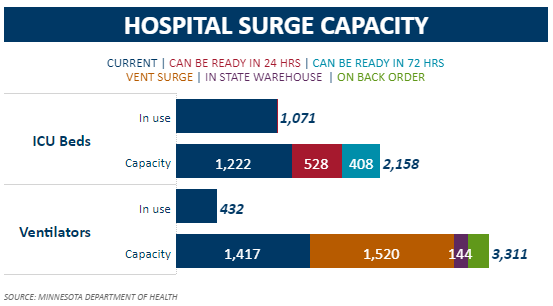
In the meantime, we can keep track of a similar metric another way. The MDH produces a data on the state’s ‘COVID-19 Response Capacity‘ which is updated each weekday. This shows that, at present, 1,071 – 87.6% – out of the state’s 1,222 ICU beds are in use (the numbers were 1,063 and 1,222 respectively yesterday, a ratio of 87.0%).
Is this abnormally high? Figure shows a seven day moving average of the numbers for hospitalizations which the MDH has stopped reporting and, where possible, numbers for the share of ICU beds in use and also for the share of ‘surge beds’ in use (those available at 72 hours notice). This seems to show that we are at record levels of the share of ICU beds in use.
Figure 1: Covid-19 hospitalization and ICU bed usage in Minnesota
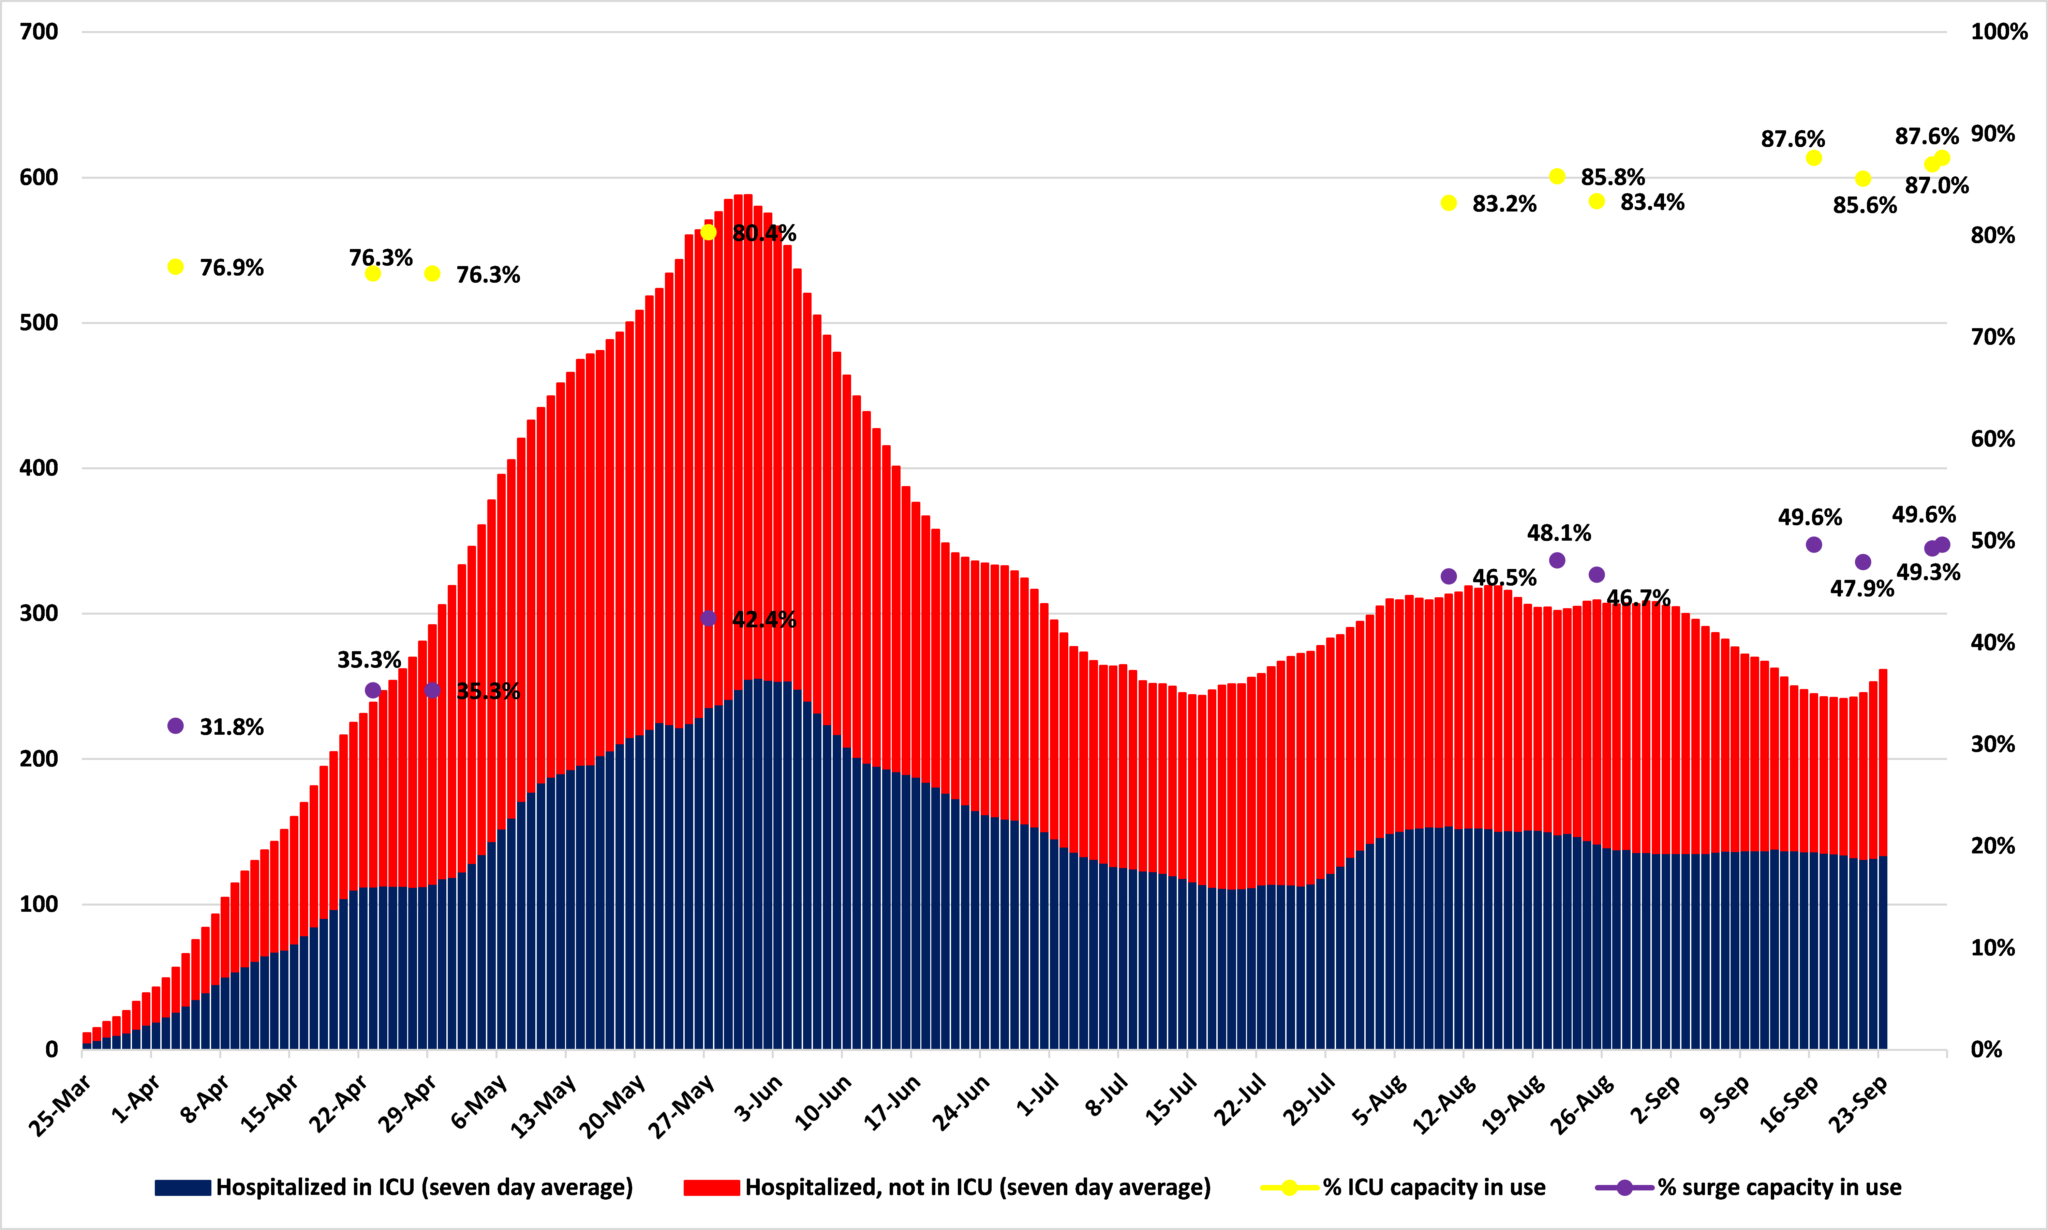
Source: Minnesota Department of Health
But two things should be borne in mind.
First, what is the ratio normally? As yet, I have been unable to find comparable figures for previous years. Maybe this level of usage is normal?
Second, the changes in the ratio of ICU beds in use is driven as much by the number of beds as the number of patients. Figure 3 shows that, for the data points we have,* ICU capacity was actually higher in late May than it is now. Surge capacity peaked in early April and has been trending down since. A possible explanation for this would be that, despite its public protestations, the state government actually feels that it needs fewer ICU and surge beds than it previously thought.
Figure 2: Minnesota’s ICU beds in use, in total, and ‘surge’ capacity
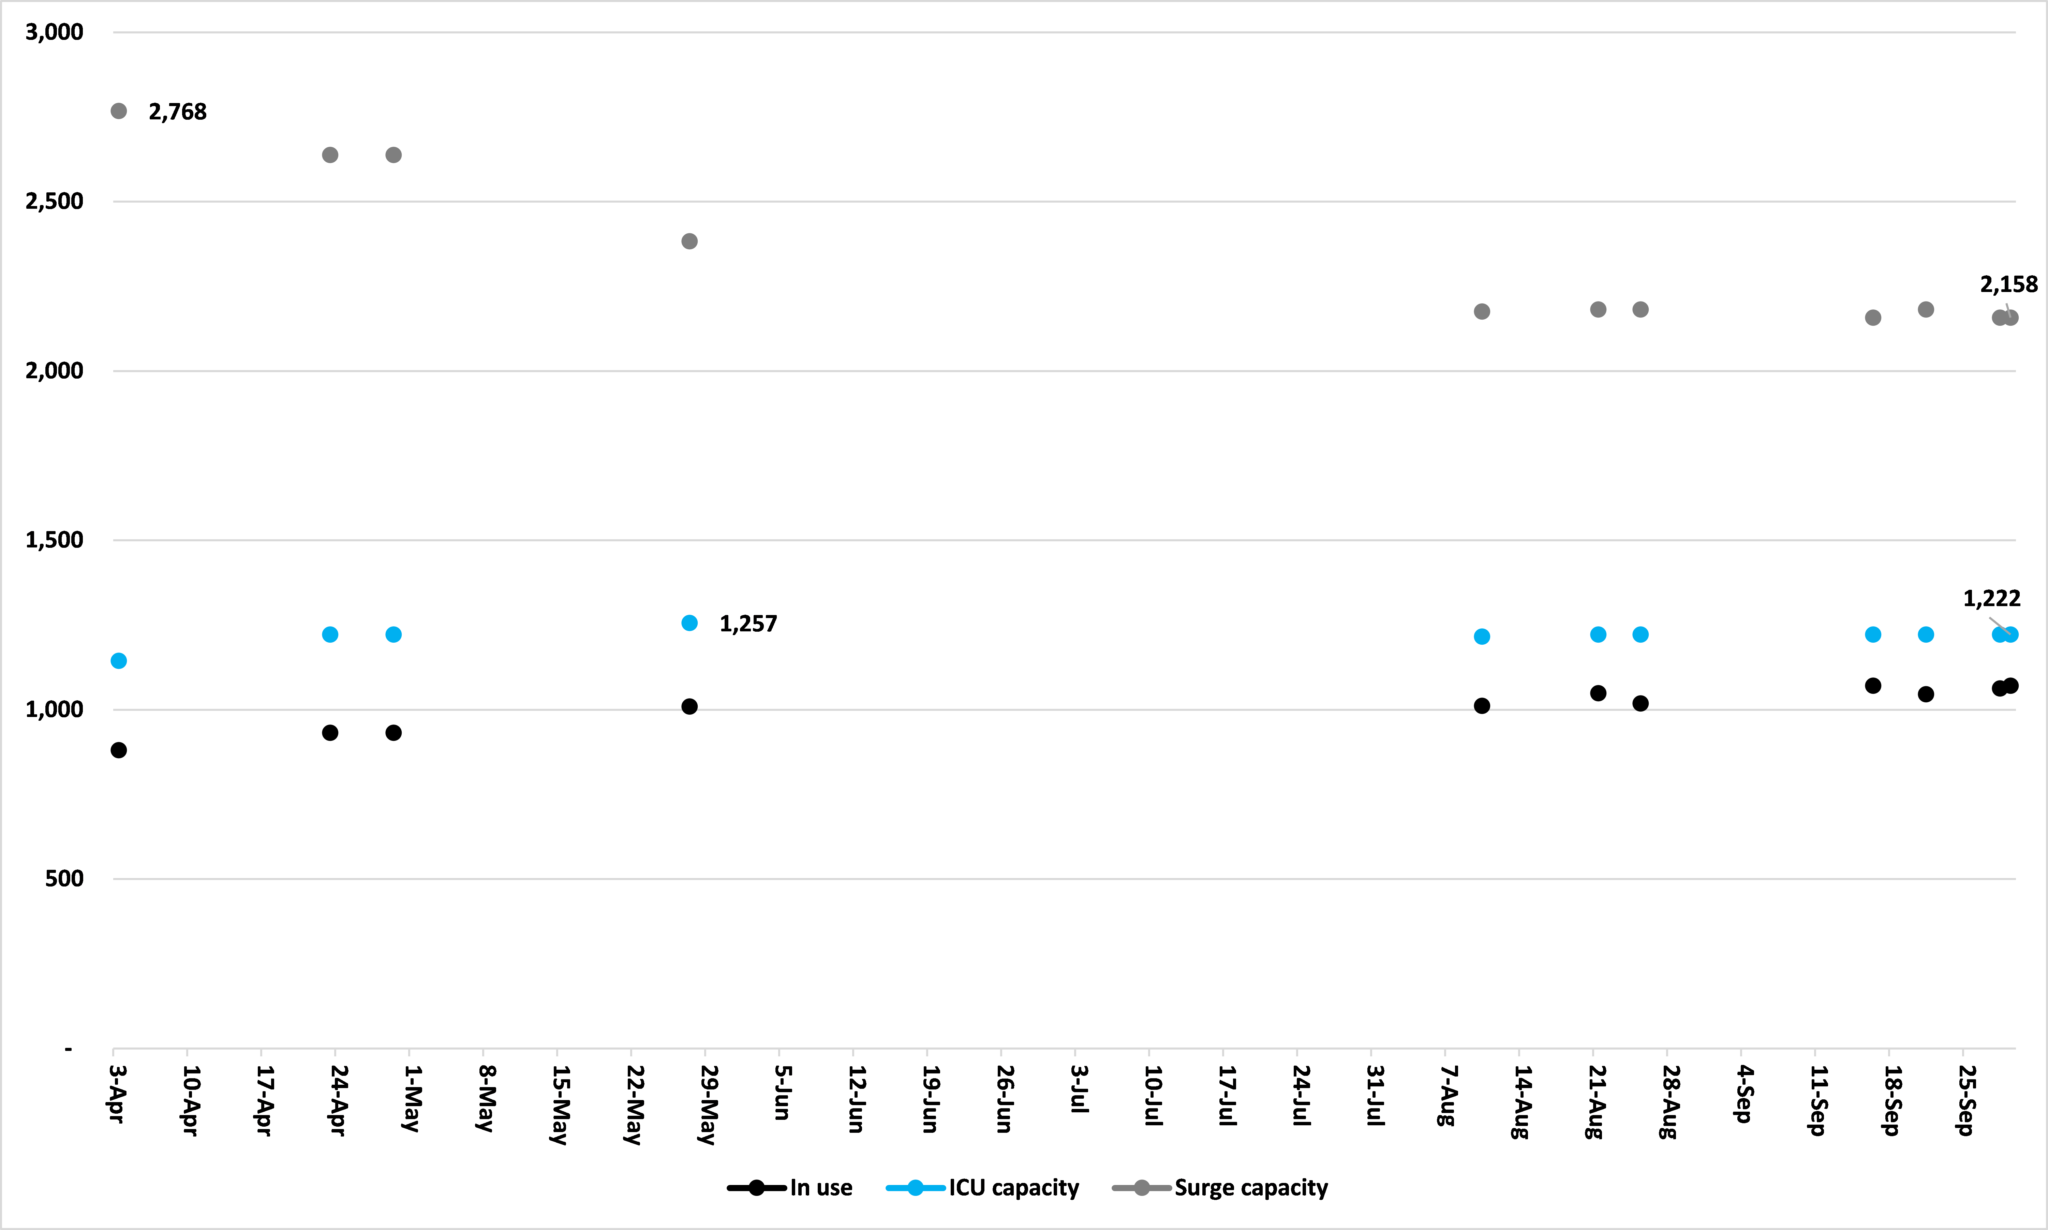
Source: Minnesota Department of Health
Whatever the reason, these seem to be the key metrics for judging whether or not Minnesota needs to remain under Gov. Walz personal rule. Figures for admissions which the MDH now reports instead of total hospitalizations, are only half the story and are simply intended to keep people scared. Accepting his argument that the spread of the disease cannot be stopped and that all we can do is build up capacity to cope with its acute cases, the share of ICU beds in use – and the total available – tells us how well we are equipped to achieve that.
*Regrettably I do not have a full series of these numbers. One will be maintained from now on.
John Phelan is an economist at the Center of the American Experiment.