Two months on from Texas reopening, it is doing better against COVID-19 than Minnesota
On May 13 2020, Wisconsin’s Supreme Court struck down Gov. Tony Evers’ “Safer at Home” order. The tweet below, from DFL Chair Ken Martin, was typical of the reaction:
As I pointed out in July last year, Martin was completely wrong:
Figures from the Minnesota Department of Health and Wisconsin Department of Health Services show that, from May 14th to July 27th, Wisconsin suffered 472 Covid-19 deaths and Minnesota suffered 939, as seen on Figure 1. Again, given the two state’s broadly similar populations – 5.6 million in Minnesota and 5.8 million in Wisconsin – that means a much higher rate of Covid-19 deaths in our state as well as a much higher number. Indeed, between May 14th and July 27th, Wisconsin saw 81 Covid-19 deaths per million residents. In Minnesota, we saw 167 Covid-19 deaths per million residents – a rate 2.1 times higher.
Figure 1: Cumulative Covid-19 deaths, May 14th to July 27th
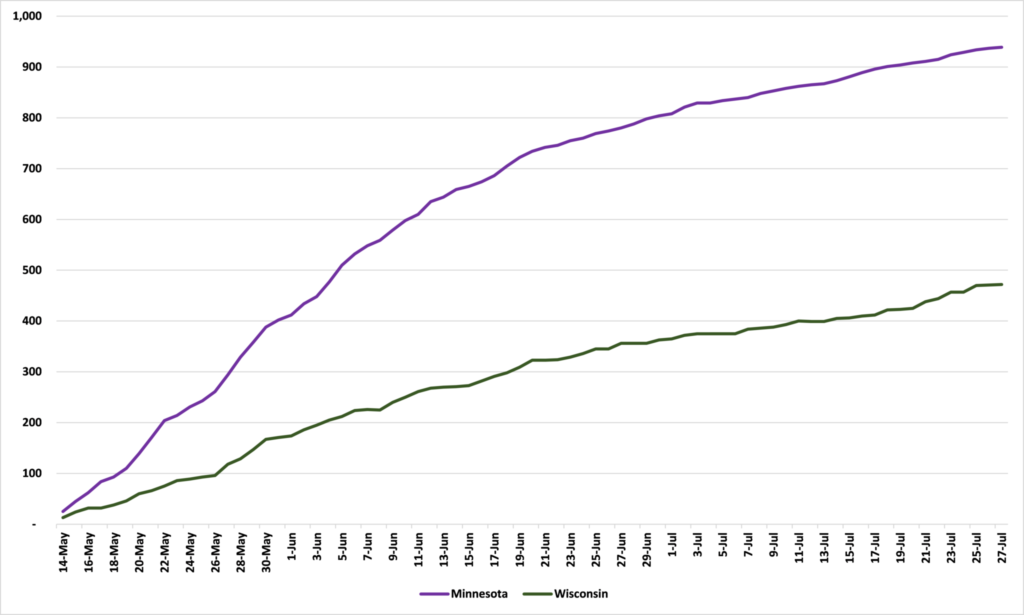
Source: Minnesota Department of Health and Wisconsin Department of Health Services
The huge increase in Covid-19 deaths that Mr. Martin predicted due to Wisconsin’s “terrible courts” haven’t materialized. In fact, Minnesota has performed far worse. To what does Mr. Martin attribute our state’s woeful performance?
Sad Sack strikes again
On March 2 2021, Texas Governor Greg Abbott issued an Executive Order lifting the state’s mask mandate and increasing capacity of all businesses and facilities in the state to 100 percent.
As with Wisconsin last May, the reaction on social media was sheer hysterics. President Biden said it was a “big mistake” which reflected “Neanderthal thinking.” And, not to be left out, Steve Sack chimed in again:
So, how is Texas coping eleven weeks on?
Figure 1 shows a seven day moving average of new COVID-19 cases per million of the population from the start of 2021. In the seven days up to and including March 2, Texas recorded an average of 15.5 new cases per million: in the seven days up to and including May 18, that number had fallen to 4.8 new cases per million. For comparison, Minnesota recorded 12.8 new cases per million in the seven days up to and including May 18.
Figure 1: New cases of COVID-19 per million of the population, seven day moving average
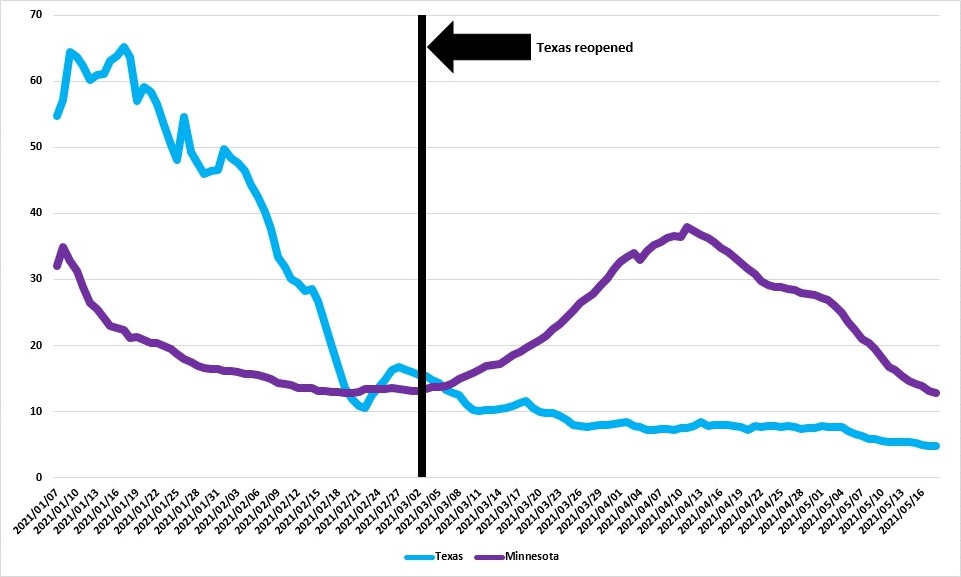
Source: Texas Department of State Health Services and Minnesota Department of Health
What about fatalities?
Figure 2 shows the seven day moving average of new deaths with COVID-19 per million of the population from the start of 2021. In the seven days up to and including March 2, Texas recorded an average of 0.4 new deaths per million: in the seven days up to and including May 18, that number had fallen to 0.0 (technically 0.04) new deaths per million. Again, for comparison, Minnesota recorded 0.2 new deaths per million in the seven days up to and including May 18.
Figure 2: Deaths with COVID-19 per million of the population, seven day moving average*
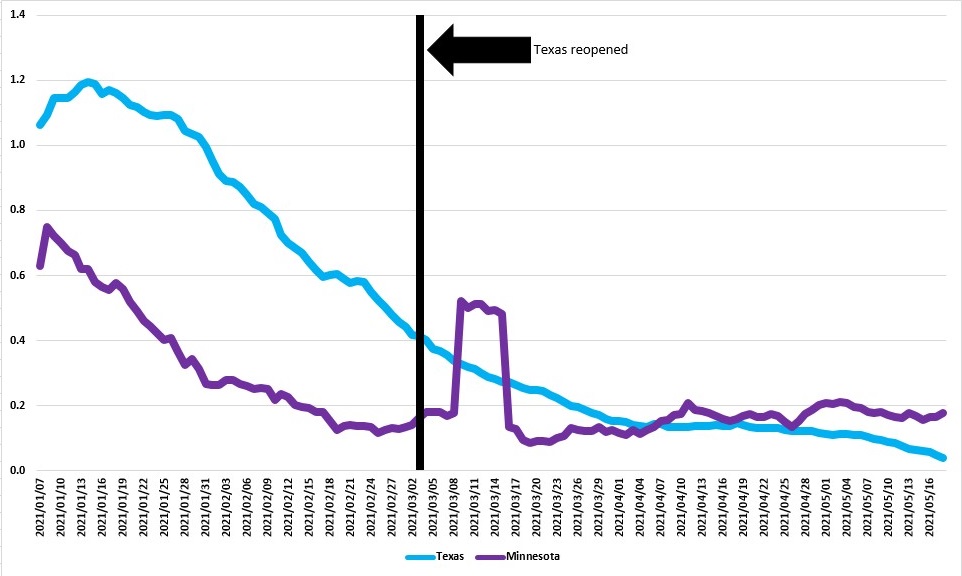
Source: Texas Department of State Health Services and Minnesota Department of Health
Once again, we see exactly the same thing: there is a move to loosen COVID-19 restrictions somewhere, people lose their minds, Steve Sack does a cartoon predicting mass death for the state in question, and that state then goes on to do ok. Better, in fact, than Minnesota.
Will people learn? Probably not if they didn’t last time. Being wrong is ok. But being wrong in exactly the same way time and time again is not ok. It shows that you aren’t looking at evidence, you are clinging to dogma. There has been too much of that over the course of this pandemic.
John Phelan is an economist at the Center of the American Experiment.