Where does Minnesota stand in its fight against Covid-19?
Back in September, I wrote:
For the time being at least, while COVID-19 is still with us, the data is clear: The emergency period of this pandemic is over.
I wrote this because, as I’ve argued, the share of Minnesota’s ICU beds in use is the correct benchmark for whether we are in an emergency or not. And:
ICU hospitalizations, the health department said, surged from an average of 111 for the seven days up to and including July 18 to 154 for the seven days up to and including Aug. 10 — still below any time between May 6 and June 29. Since then, the numbers have trended downward again. In the seven days up to and including Sept. 17, the average number of ICU hospitalizations for COVID-19 in Minnesota was 135. The number of non-ICU hospitalizations has fallen from an average of 173 for the seven days up to and including Aug. 31 to 107 for the seven days up to and including Sept. 17.
Is this still the case? Yesterday, WCCO carried a story titled ‘With Minnesota COVID Cases Soaring, Will State Officials Dial Back Again?‘ Indeed, as Department of Health numbers show, in the seven days up to and including September 17th, Minnesota recorded an average of 814 cases daily. For the seven days up to and including October 27th – more recent data is subject to change due to deduplication of results – the daily average of cases was up to 2,339. Neither was this simply a result of more testing. As Figure 1 shows, the share of tests returning positive results rose from 4.5% in the seven days up to and including September 17th to 9.4% in the seven days up to and including October 27th.
Figure 1: Seven day moving averages of Covid-19 tests conducted and percentage of tests positive in Minnesota
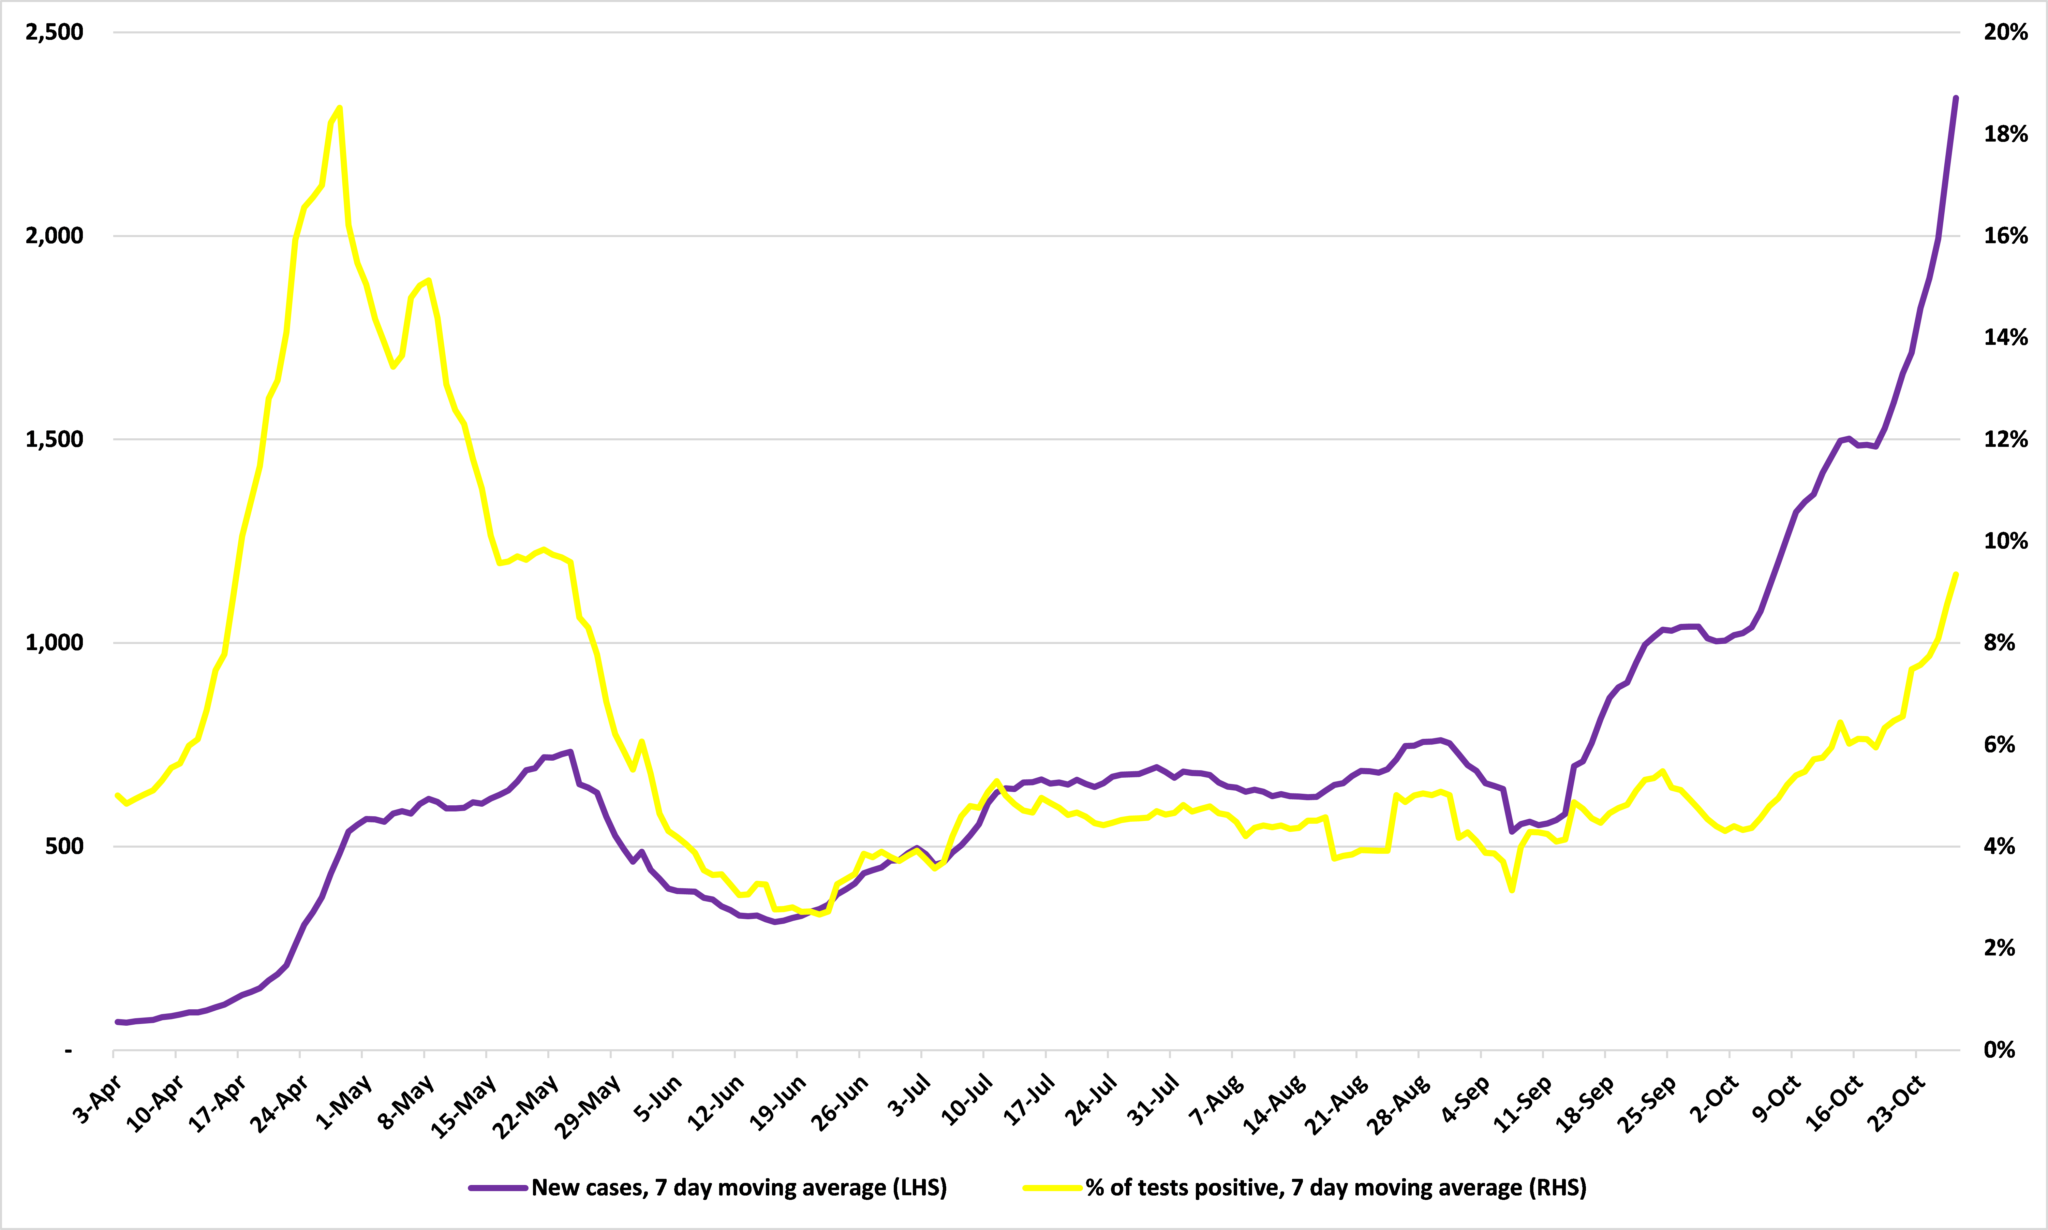
Source: Minnesota Department of Health
As Figure 2 shows, Department of Health numbers show that this rise in cases is leading to a rise in hospitalizations, both ICU and non-ICU.* While the rise in ICU hospitalizations is more gradual than it was in April and May and they remain below the peak of 263 on May 30th, this is, nevertheless, a concerning sign.
Figure 2: ICU and non-ICU Covid-19 hospitalizations in Minnesota, seven day moving averages
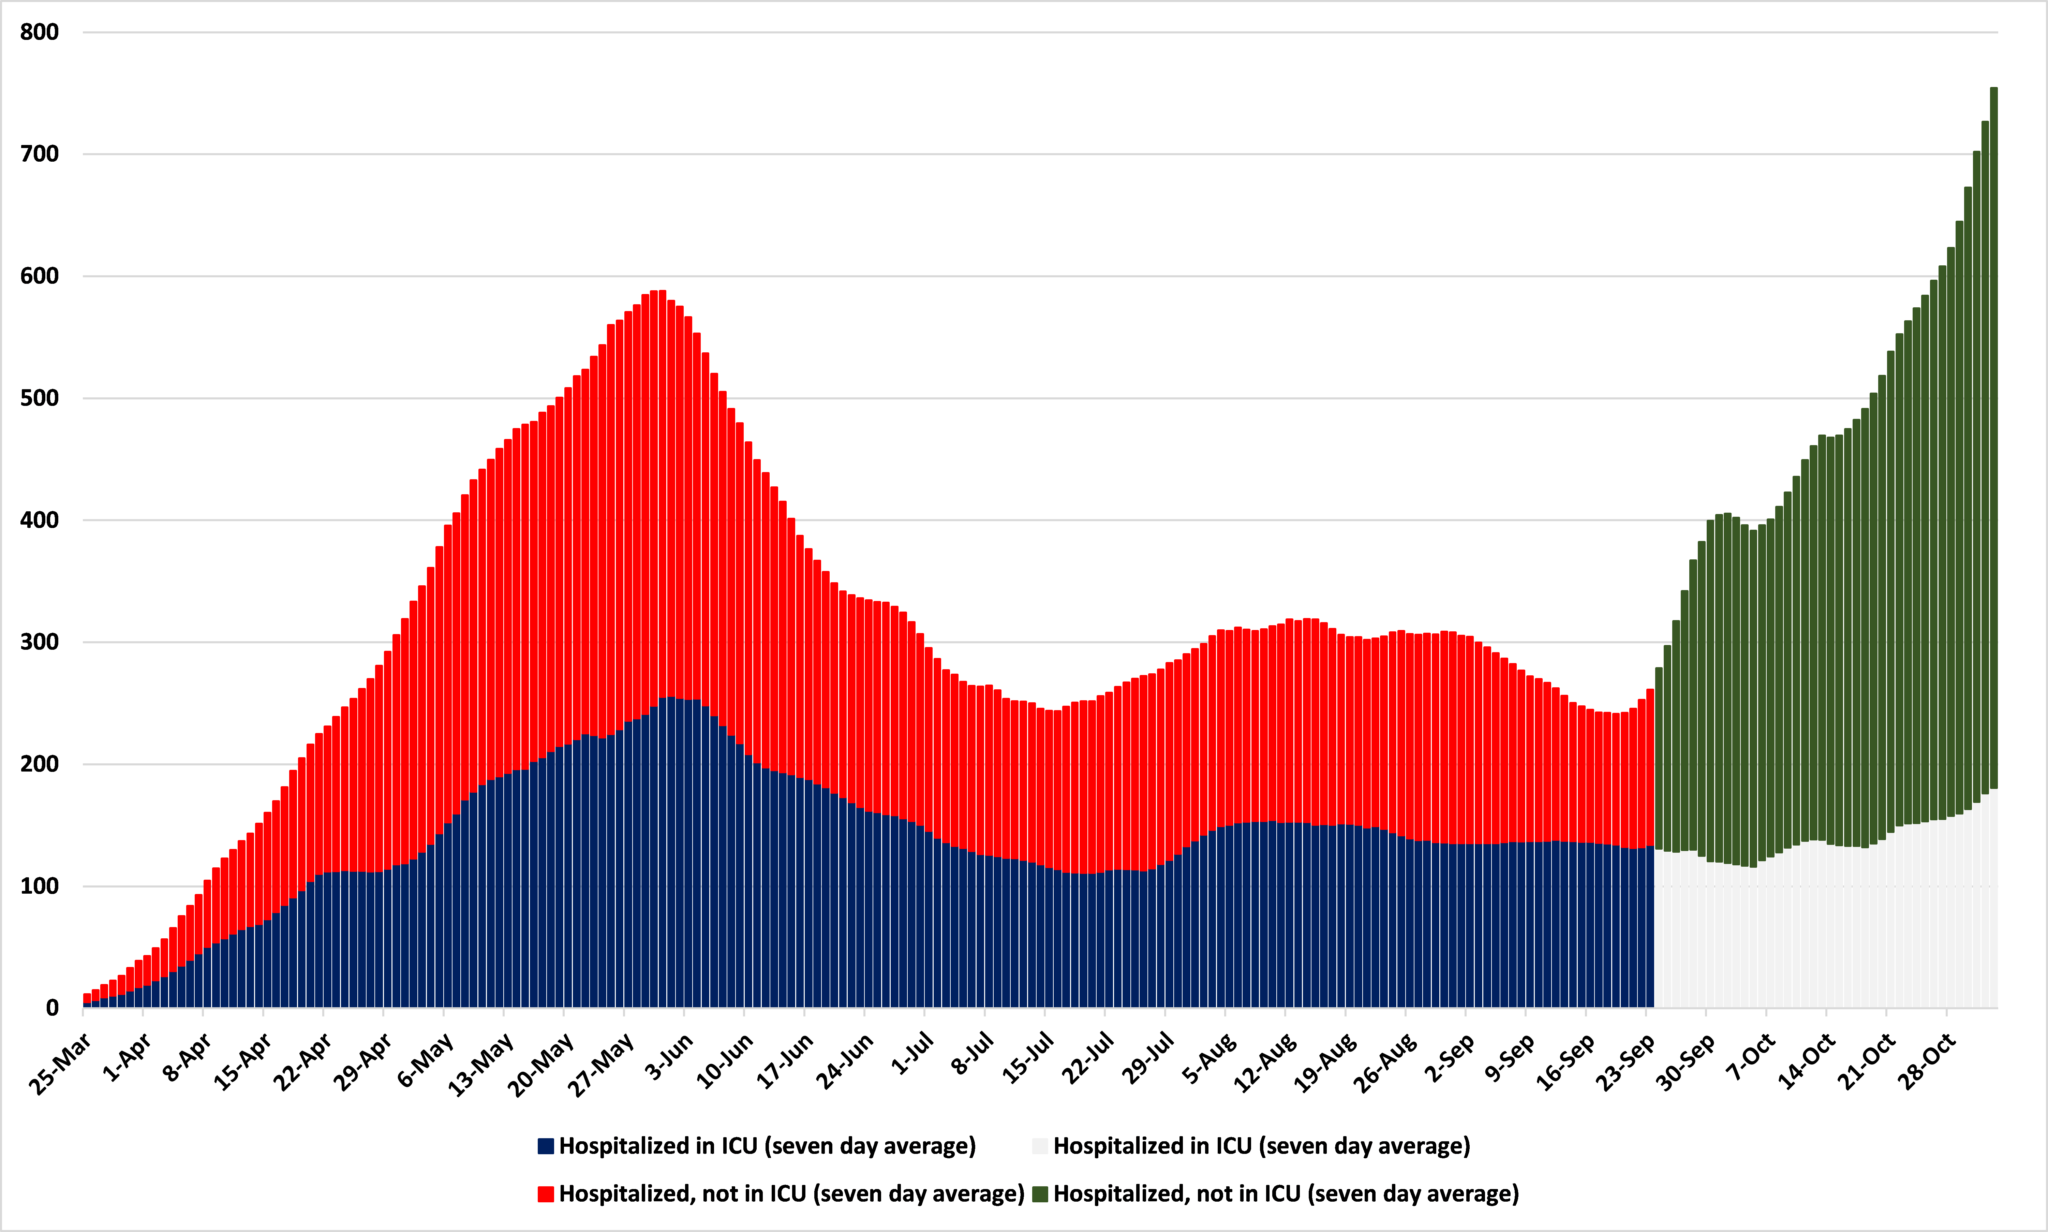
Source: Minnesota Department of Health
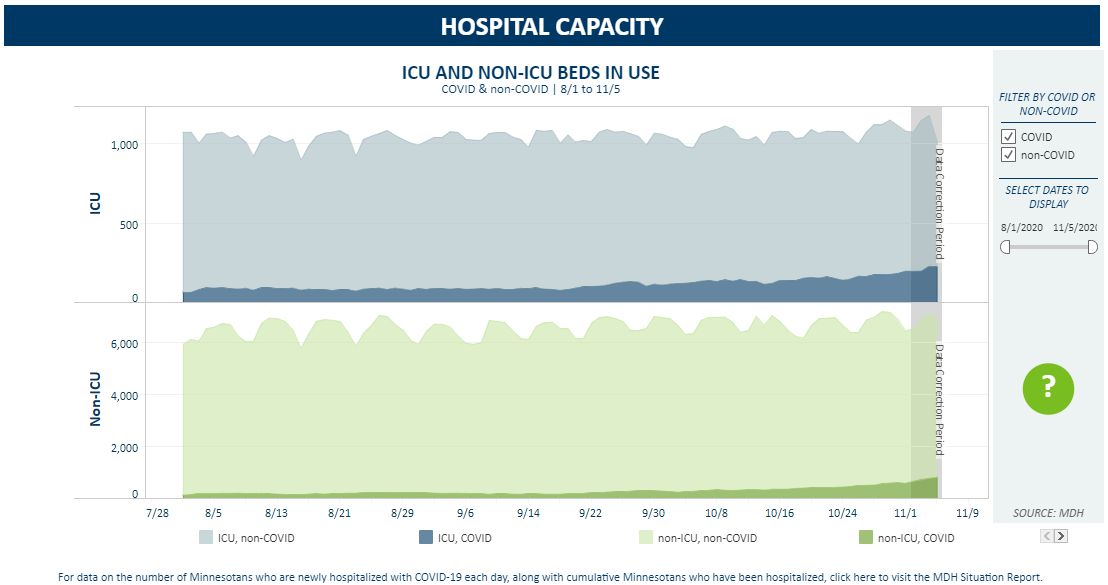
There is some good news. Department of Health numbers, seen Seen in Figure 3, show that 77.8% of Minnesota’s 1,306 ICU beds are in use as are another 20 (4.9%) of its ICU surge beds. Covid-19 patients account for 22.0% of ICU hospitalizations at present, as Figure 4 shows. For non-ICU hospitalizations, 71.9% of beds are in use, 11.7% of which are Covid-19 cases.
Figure 3
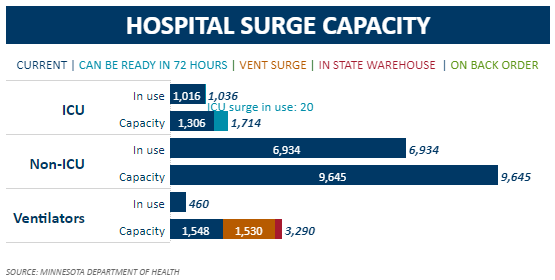
Figure 4
These numbers need to be kept in context. Back on April 29th, Gov. Walz announced:
“I today can comfortably tell you that, when we hit our peak — and it’s still projected to be about a month away — if you need an ICU bed and you need a ventilator, you will get it in Minnesota.”
That was when ICU usage was forecast to peak at 3,397 on June 29th. Even though, thankfully, we have never come close to these numbers, we have the beds to handle them. The availability of nurses is another matter.
*The discontinuity in the series is explained here.
John Phelan is an economist at the Center of the American Experiment.