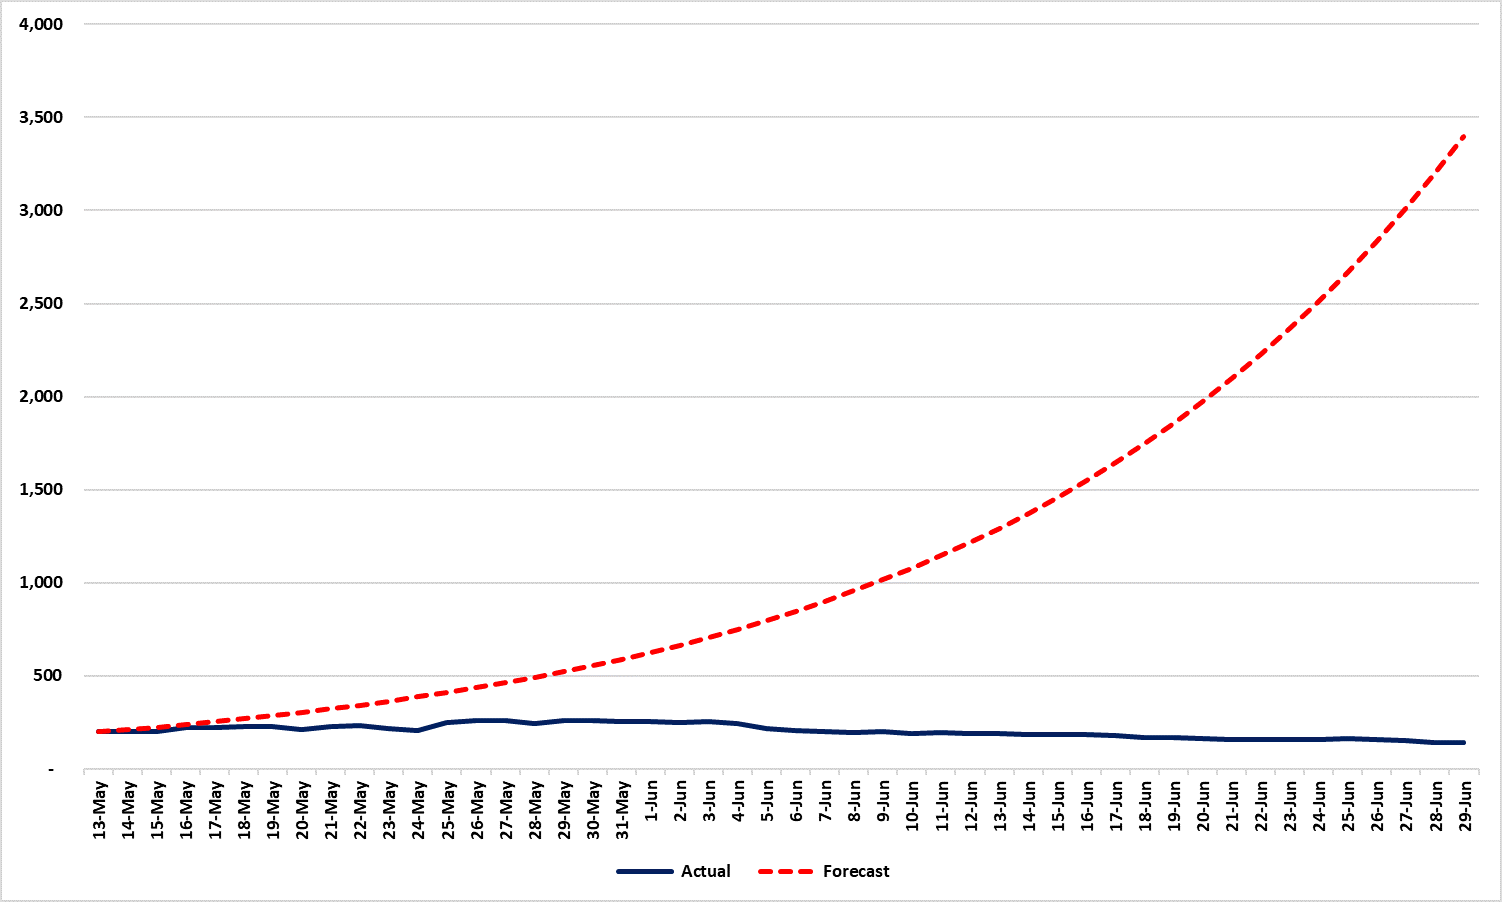
Minnesota’s COVID-19 model forecast 3,400 in ICU on June 29th: There were 140
On May 13th, the state government unveiled Version 3 of its Covid-19 model. This forecasted that with the stay-at-home order (SHO) in effect to May 18th – the measures then in place – Minnesota would see 1,441 Covid-19 deaths by the end of May. That didn’t happen. As I explained recently:
That seemed pessimistic to me. Up to that point, Minnesota had suffered 638 deaths from Covid-19 (subsequently revised down to 637) so to reach 1,441 by May 31st the state would need to see 45 deaths a day. Then, the record high of fatalities in one day was 30 (May 6th) and the average for the previous 18 days had been 22. In other words, the model which was driving state government policy forecast that the average daily death rate for the last 18 days of May would be double the average daily death rate for the previous 18 days. For the sake of curiosity, I made my own forecast that day. It was very basic: I simply took the current total number of deaths (638) and assumed that it would rise by 22 (the average of the previous 18 days) for the remaining 18 days of May. My forecast for total Covid-19 deaths in Minnesota by May 31st was 1,032.
The actual total was 1,039. Instead of averaging 45 deaths daily, Minnesota averaged just 22. Indeed, on no date did Minnesota see the 45 Covid-19 deaths a day the state’s model forecast. The state forecast was off by 401, or 28% lower than actually turned out. My back-of-an-envelope calculation, by contrast, was out by just eight, as Figure 1 shows. Indeed, as Figure 2 shows, nearly a month on, we are still below the number of deaths the model forecast for May 31st.
Figure 1: Minnesota Covid-19 deaths: forecasts and outturn
Source: Center of the American Experiment

3,397 IN ICU BY JULY 13TH
The model also forecast, with the measures in place, a peak ICU use of 3,397 beds on June 29th – yesterday.
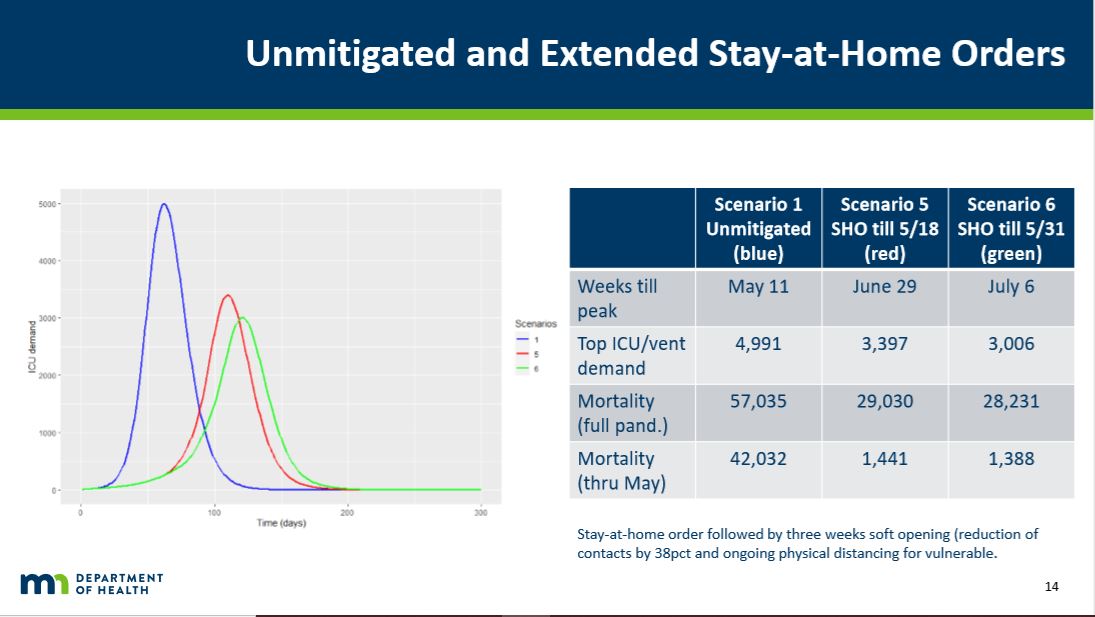
In fact, Minnesota Department of Health data shows that there were 278 Minnesotans hospitalized with Covid-19 yesterday, just 140 of whom needed ICU care. This was down from a peak of 263 on May 30th. As Figure 2 shows, this represents another complete failure for the model.
Figure 2: Minnesota’s Covid-19 ICU hospitalizations
Source: Center of the American Experiment
On June 15th, reflecting on the model’s failure thus far, I wrote:
On June 29th, we will see if the same applies to its forecasts for ICU usage. If current trends hold and Covid-19 ICU usage is in the region of 250-300 when the model forecasts 3,397, we will have every reason to junk the model and the many of the measures it has justified. This includes Gov. Walz’ emergency powers.
The verdict is now in.