Minnesota’s COVID-19 numbers look good, so why is Gov. Walz ramping up the rhetoric?
In the last few days, Gov. Walz has been ramping up his Covid-19 rhetoric with a string of tweets such as this:
States across the country are seeing #COVID19 cases surge – the easiest thing we can all do to keep Minnesota safe and keep our economy open? Wear. A. Mask. #MaskUpMN #StaySafeMN pic.twitter.com/8K8E66dqpH
— Governor Tim Walz (@GovTimWalz) July 5, 2020
Indeed, some states are seeing their Covid-19 case numbers rise. But these places are not seeing a ‘second wave’ so much as their first wave.
Minnesota’s numbers are looking better
Even so, things are looking relatively good in Minnesota – much better, in fact, that Gov. Walz’ much vaunted model said they would.
Figure 1 shows a seven day moving average of Minnesota Department of Health numbers for daily diagnoses of Covid-19 cases in the state up to June 30th*. There has, indeed, been a ‘surge’ in cases since mid-June.
Figure 1: Seven day moving average of positive Covid-19 tests
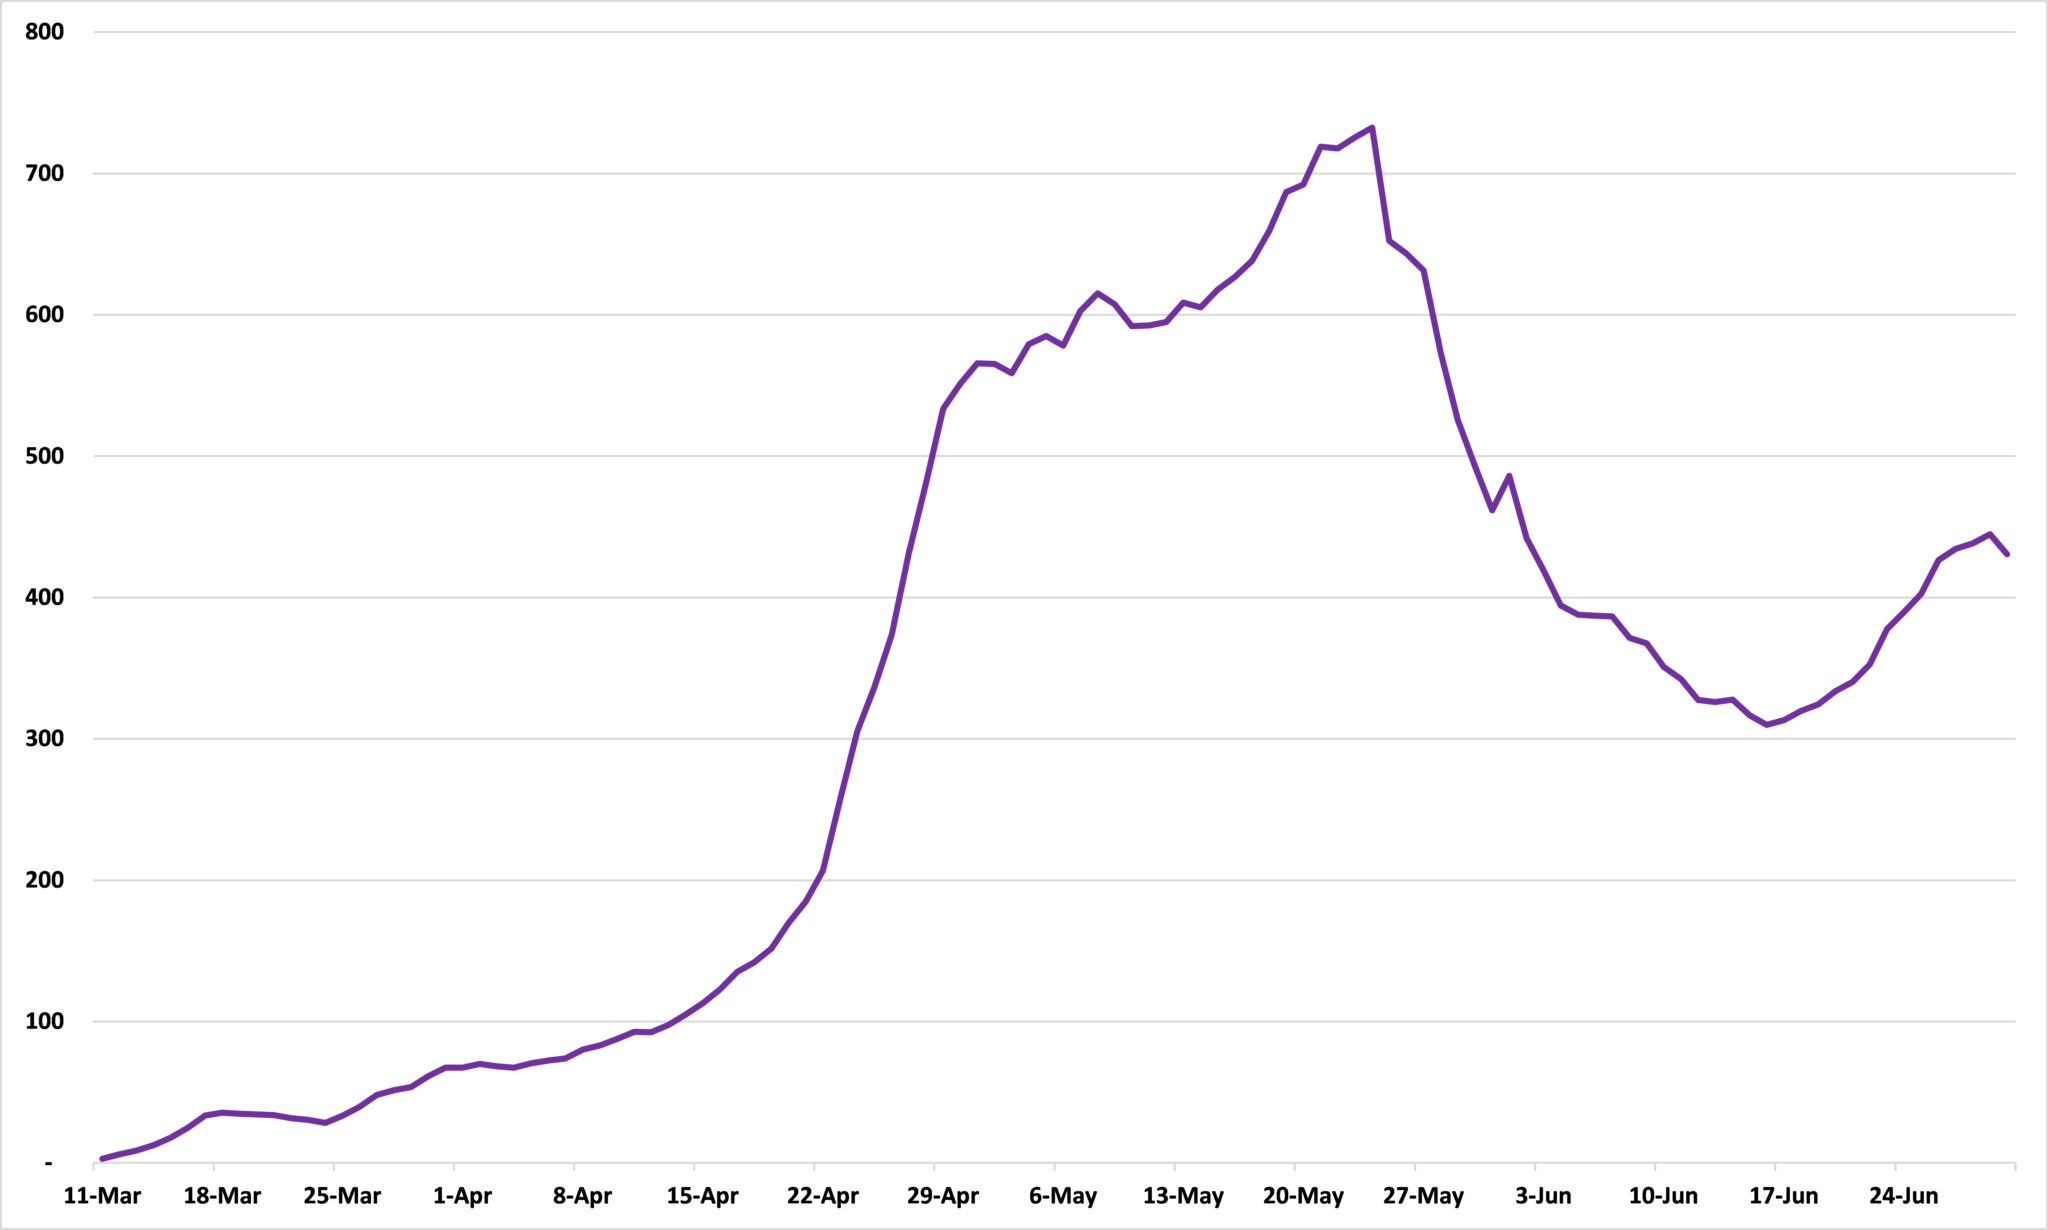
Source: Minnesota Department of Health
But it is also true that the state has vastly increased testing and, so, we would expect to find more cases. In the seven days up to April 3rd, for example, an average of 1,395 tests a day were carried out: in the seven days up to June 30th, that number was up to 12,480. As Figure 2 shows, the ratio of positive tests to all tests performed has fallen from a high of 18.9% on April 29th to 3.2% on June 30th.
Figure 2: Seven day moving average of ratio of positive Covid-19 tests
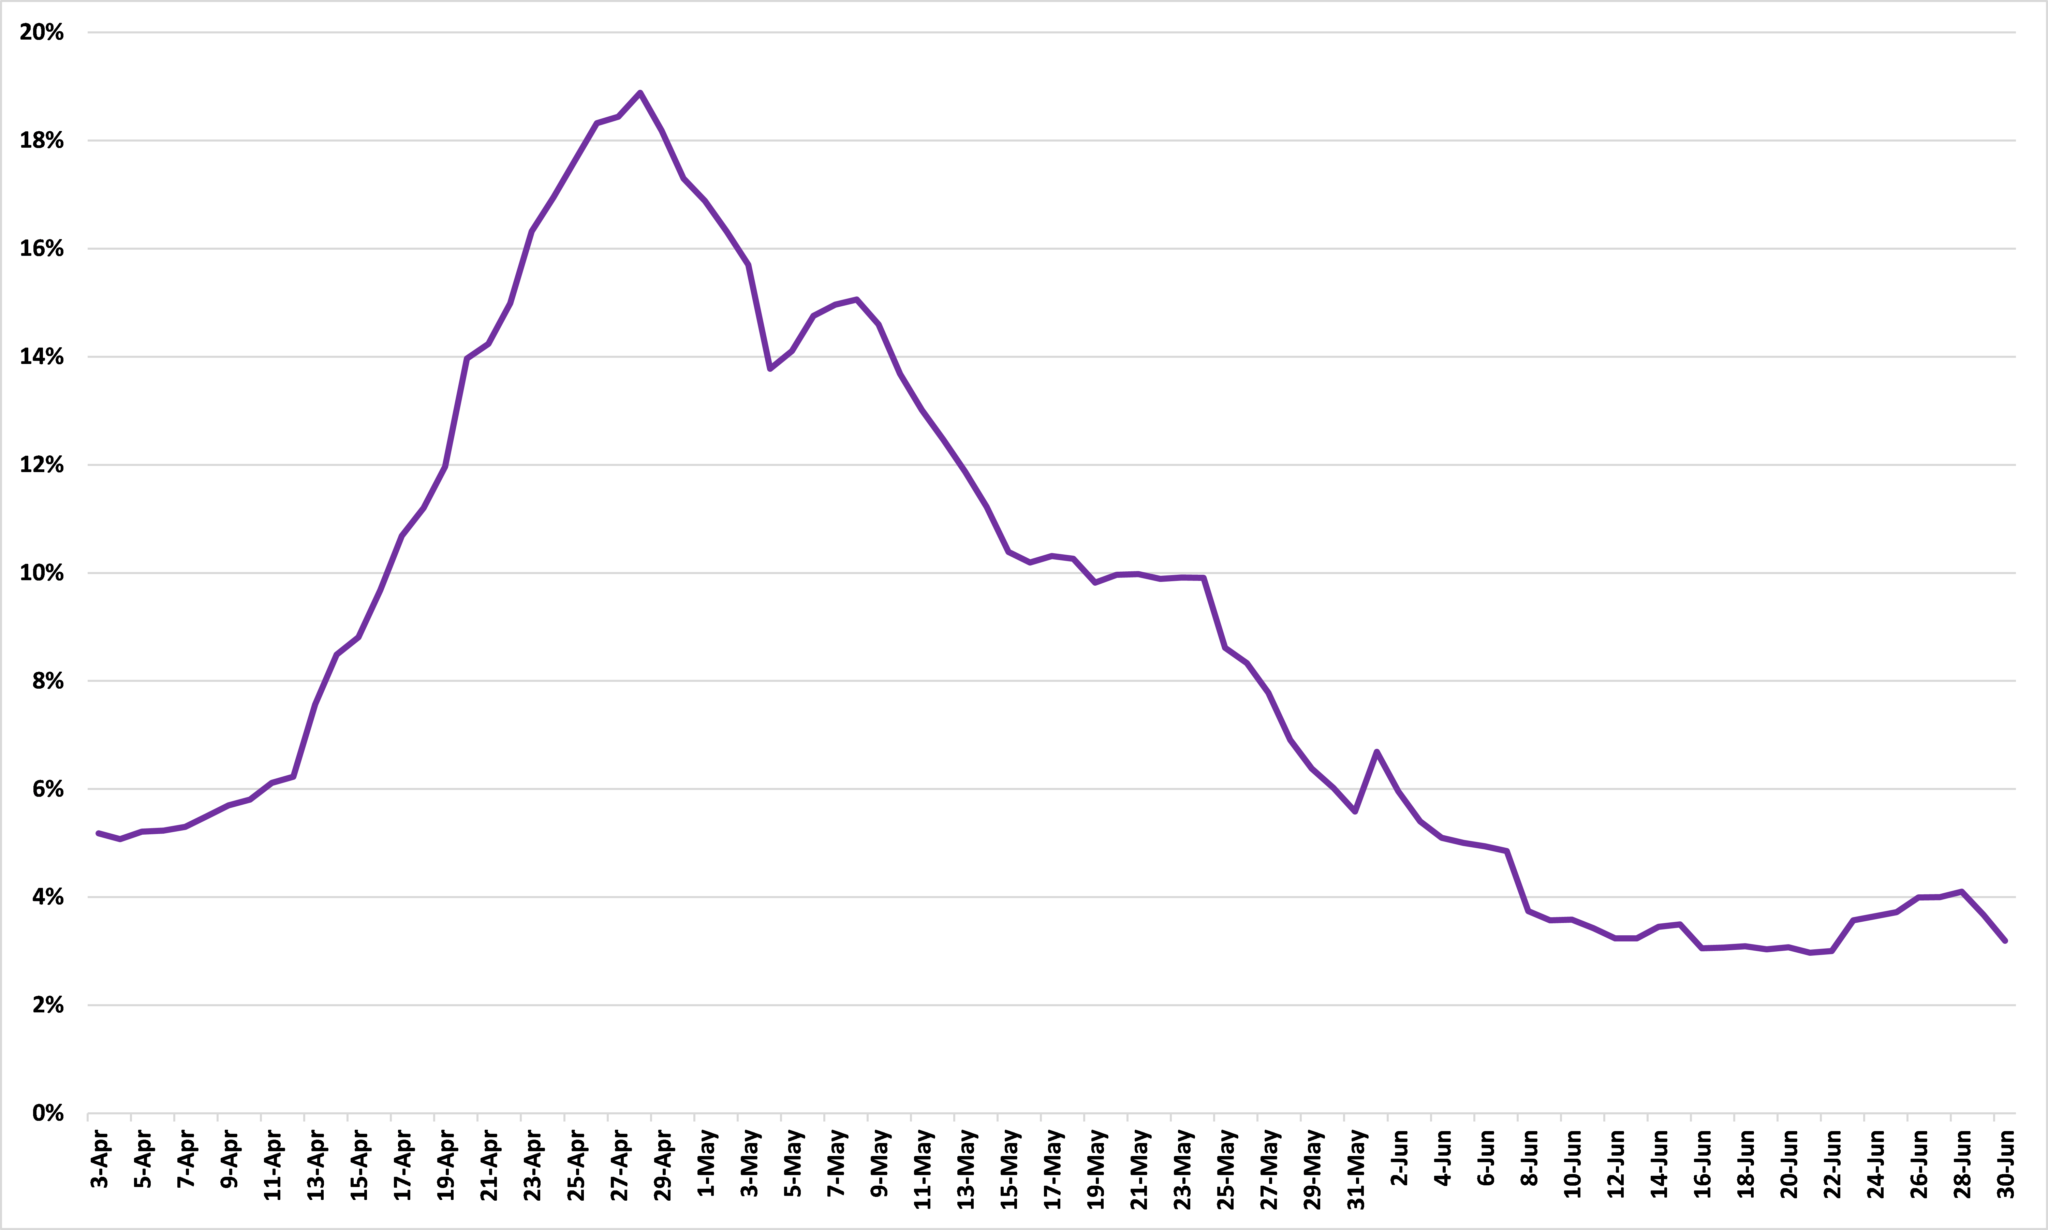
Source: Minnesota Department of Health
But, as David Montgomery of MPR points out, this is being driven by an increase in cases among the young, as Figure 3 shows.
Figure 3:
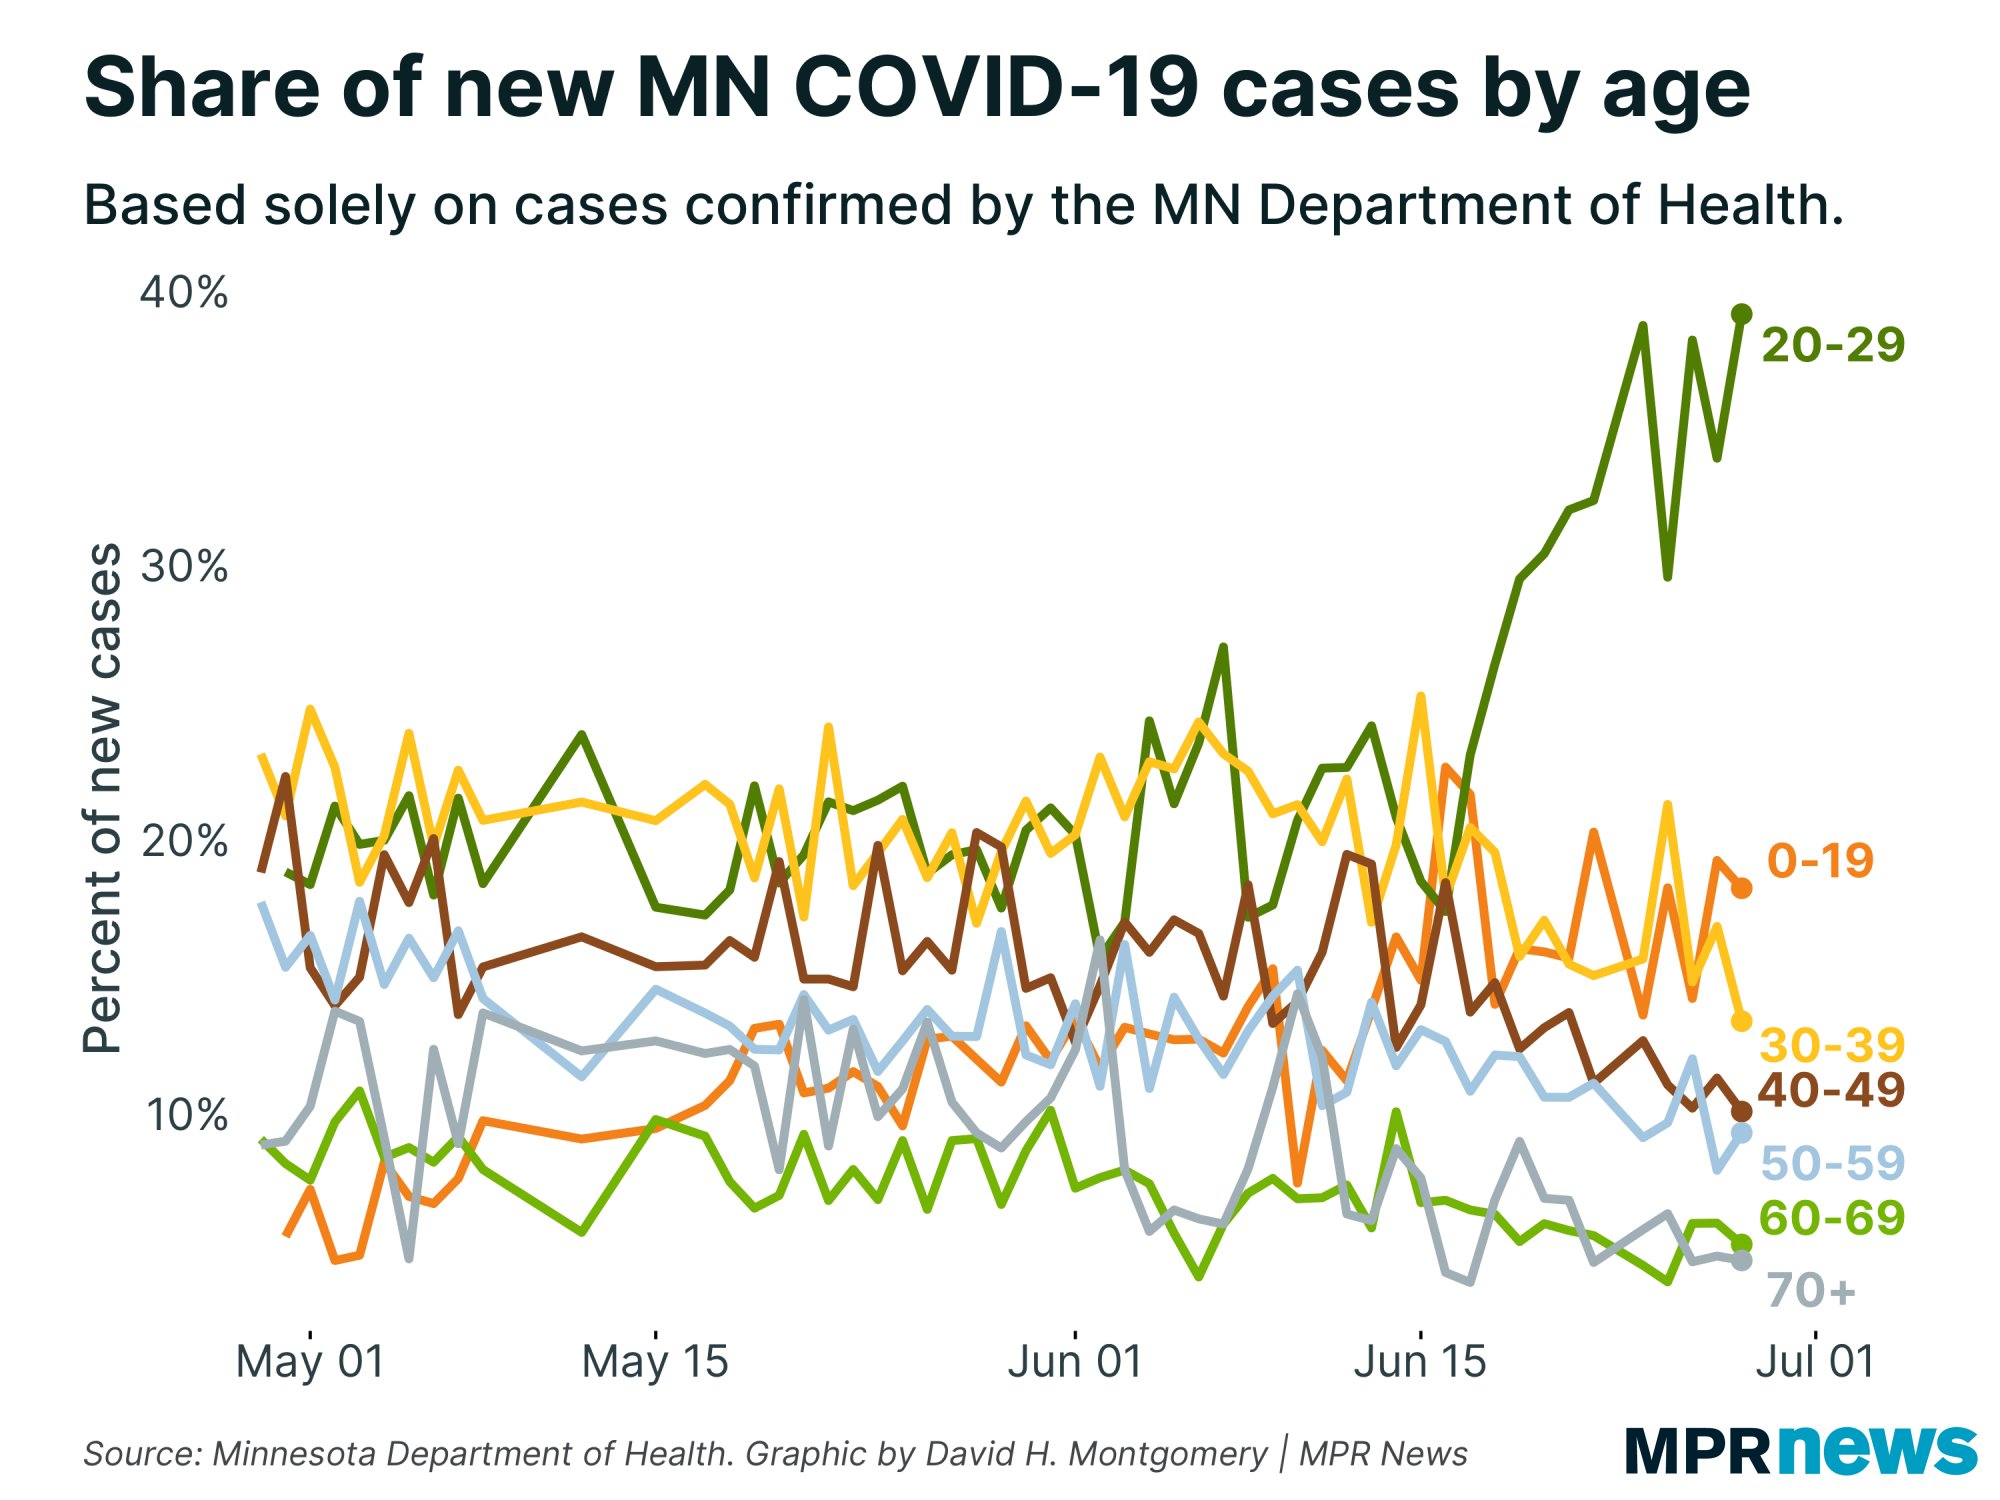
Source: MPR News
Data from the Minnesota Department of Health, shown in Figure 4, tell us that, as of July 1st, while people in the 20-29 age category accounted for 21% of all the state’s Covid-19 cases, they only account for 7% of its hospitalizations, 3% of its ICU hospitalizations, and less than 1% of its deaths.
Figure 4:
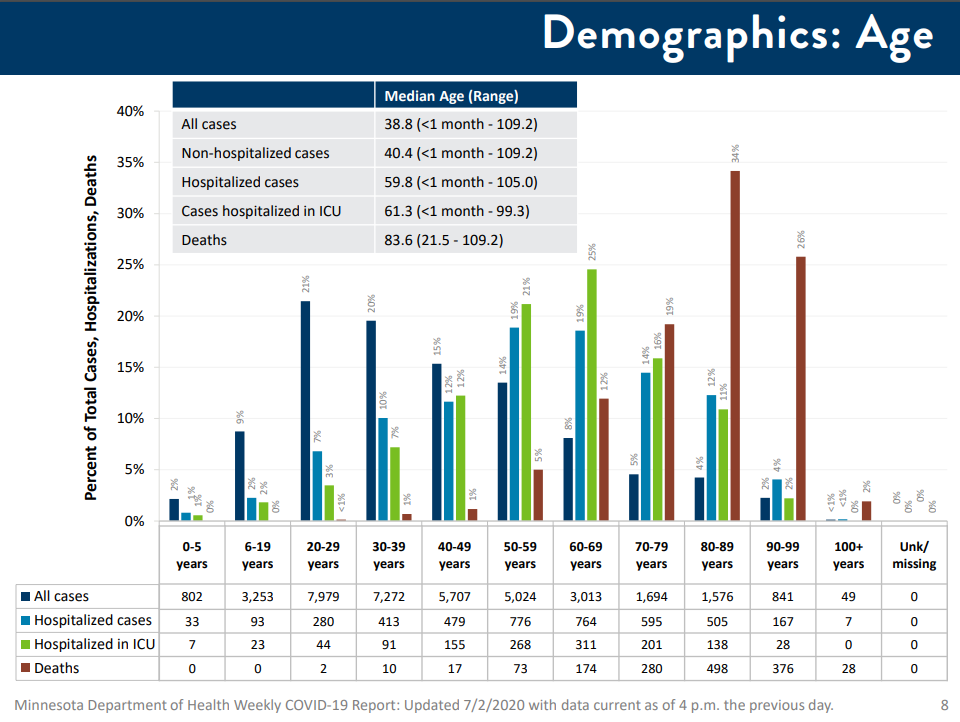
Source: Minnesota Department of Health
This explains why, with positive test results ticking up in both absolute terms and as a share of all tests, we are seeing the number of acute cases – those requiring hospitalization – and deaths continue to fall.
As Figure 5 shows, non-ICU hospitalizations peaked in Minnesota on May 28th at 364, ICU hospitalizations peaked at 263 on May 30th, and total hospitalizations peaked at 606 on May 28th. These numbers are now down to 143, 122, and 265 respectively.
Figure 5: Hospitalizations for Covid-19
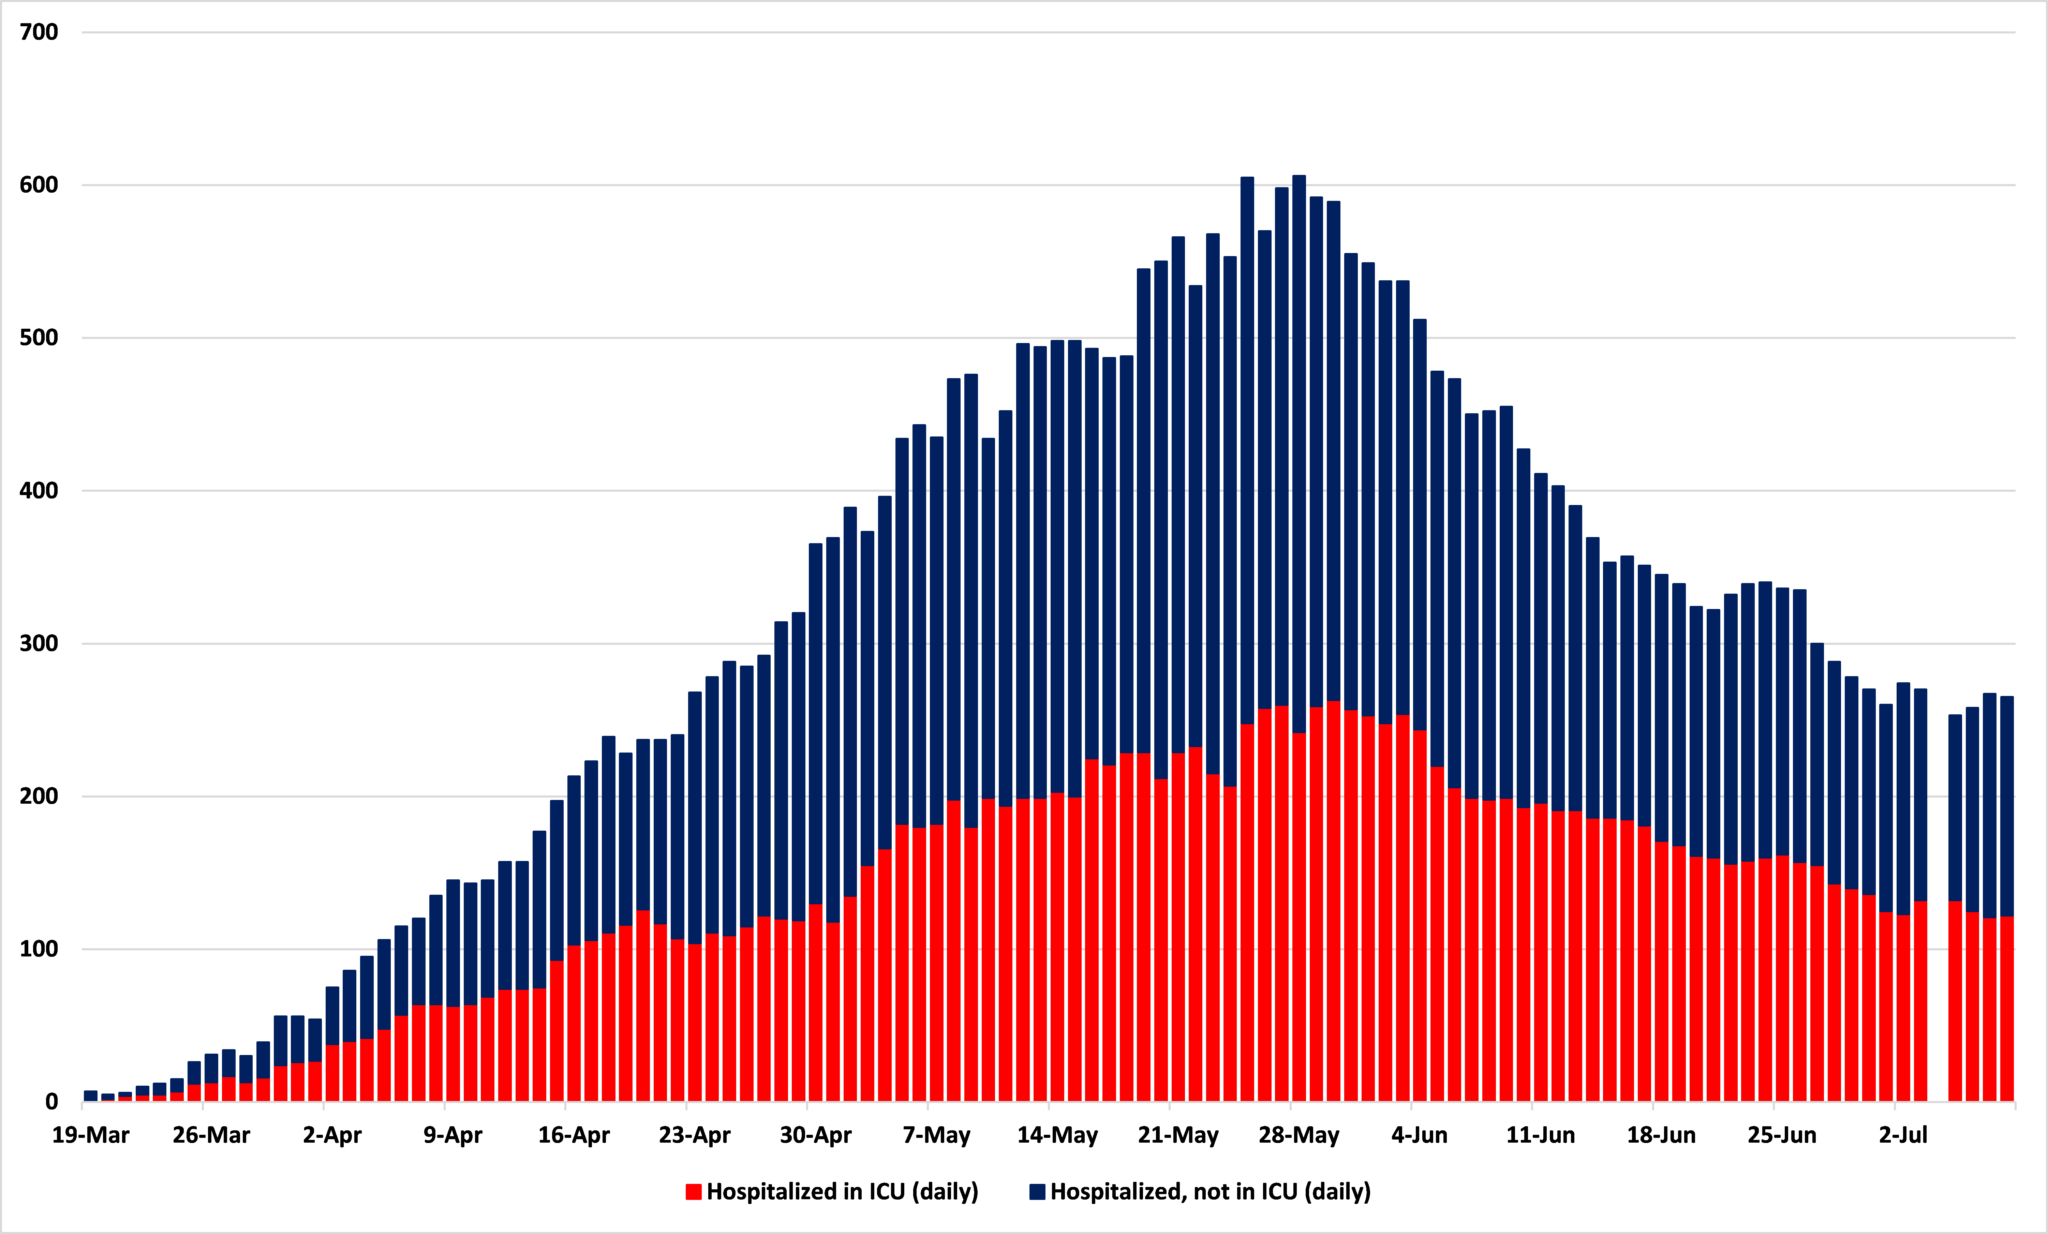
Source: Minnesota Department of Health
Figure 6 shows that daily Covid-19 deaths in Minnesota have fallen from the peak of a seven day average of 24.7 on June 2nd to 6.7 on July 8th.
Figure 6: Seven day moving average of Covid-19 deaths
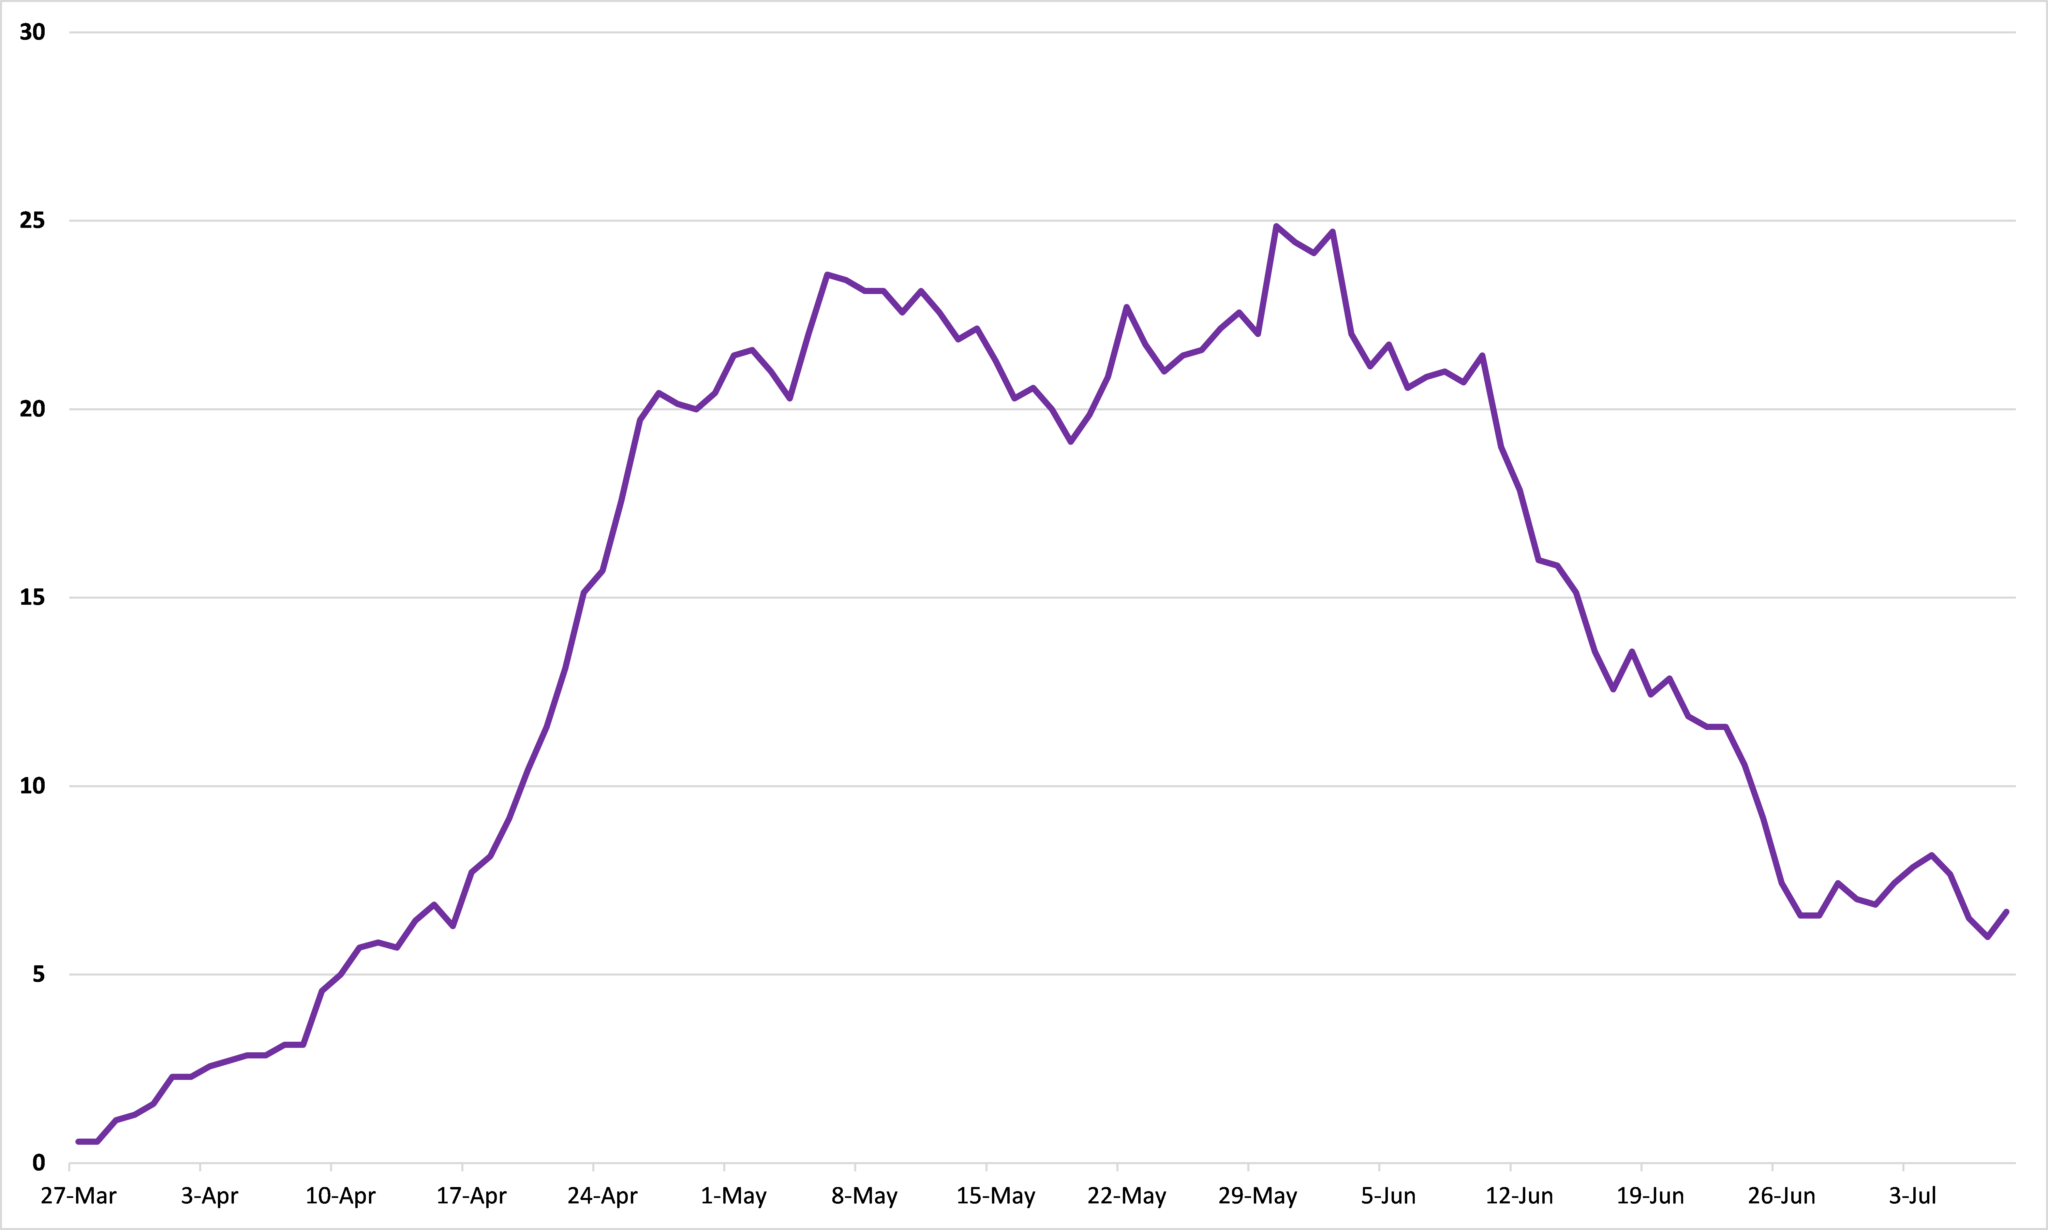
Source: Minnesota Department of Health
Putting the numbers from Figure 1 and Figure 6 together in Figure 7 reinforces the point that the current surge in cases is not like the previous one. In April, the surge in Covid-19 cases was closely followed by a surge in Covid-19 deaths. By contrast, the surge in Covid-19 cases since mid-June has been accompanied by a continued fall in Covid-19 deaths. Those who say ‘Just you wait’ and say that the current surge in cases means that another surge in deaths is just around the corner need to explain why the lag between the surge in cases and the surge in deaths is so much greater now than it was in April. A more likely scenario is that the current surge in cases is composed mostly of younger people who are less affected by the disease.
Figure 7: Seven day moving average of positive Covid-19 tests and seven day moving average of Covid-19 deaths per 100,000 people
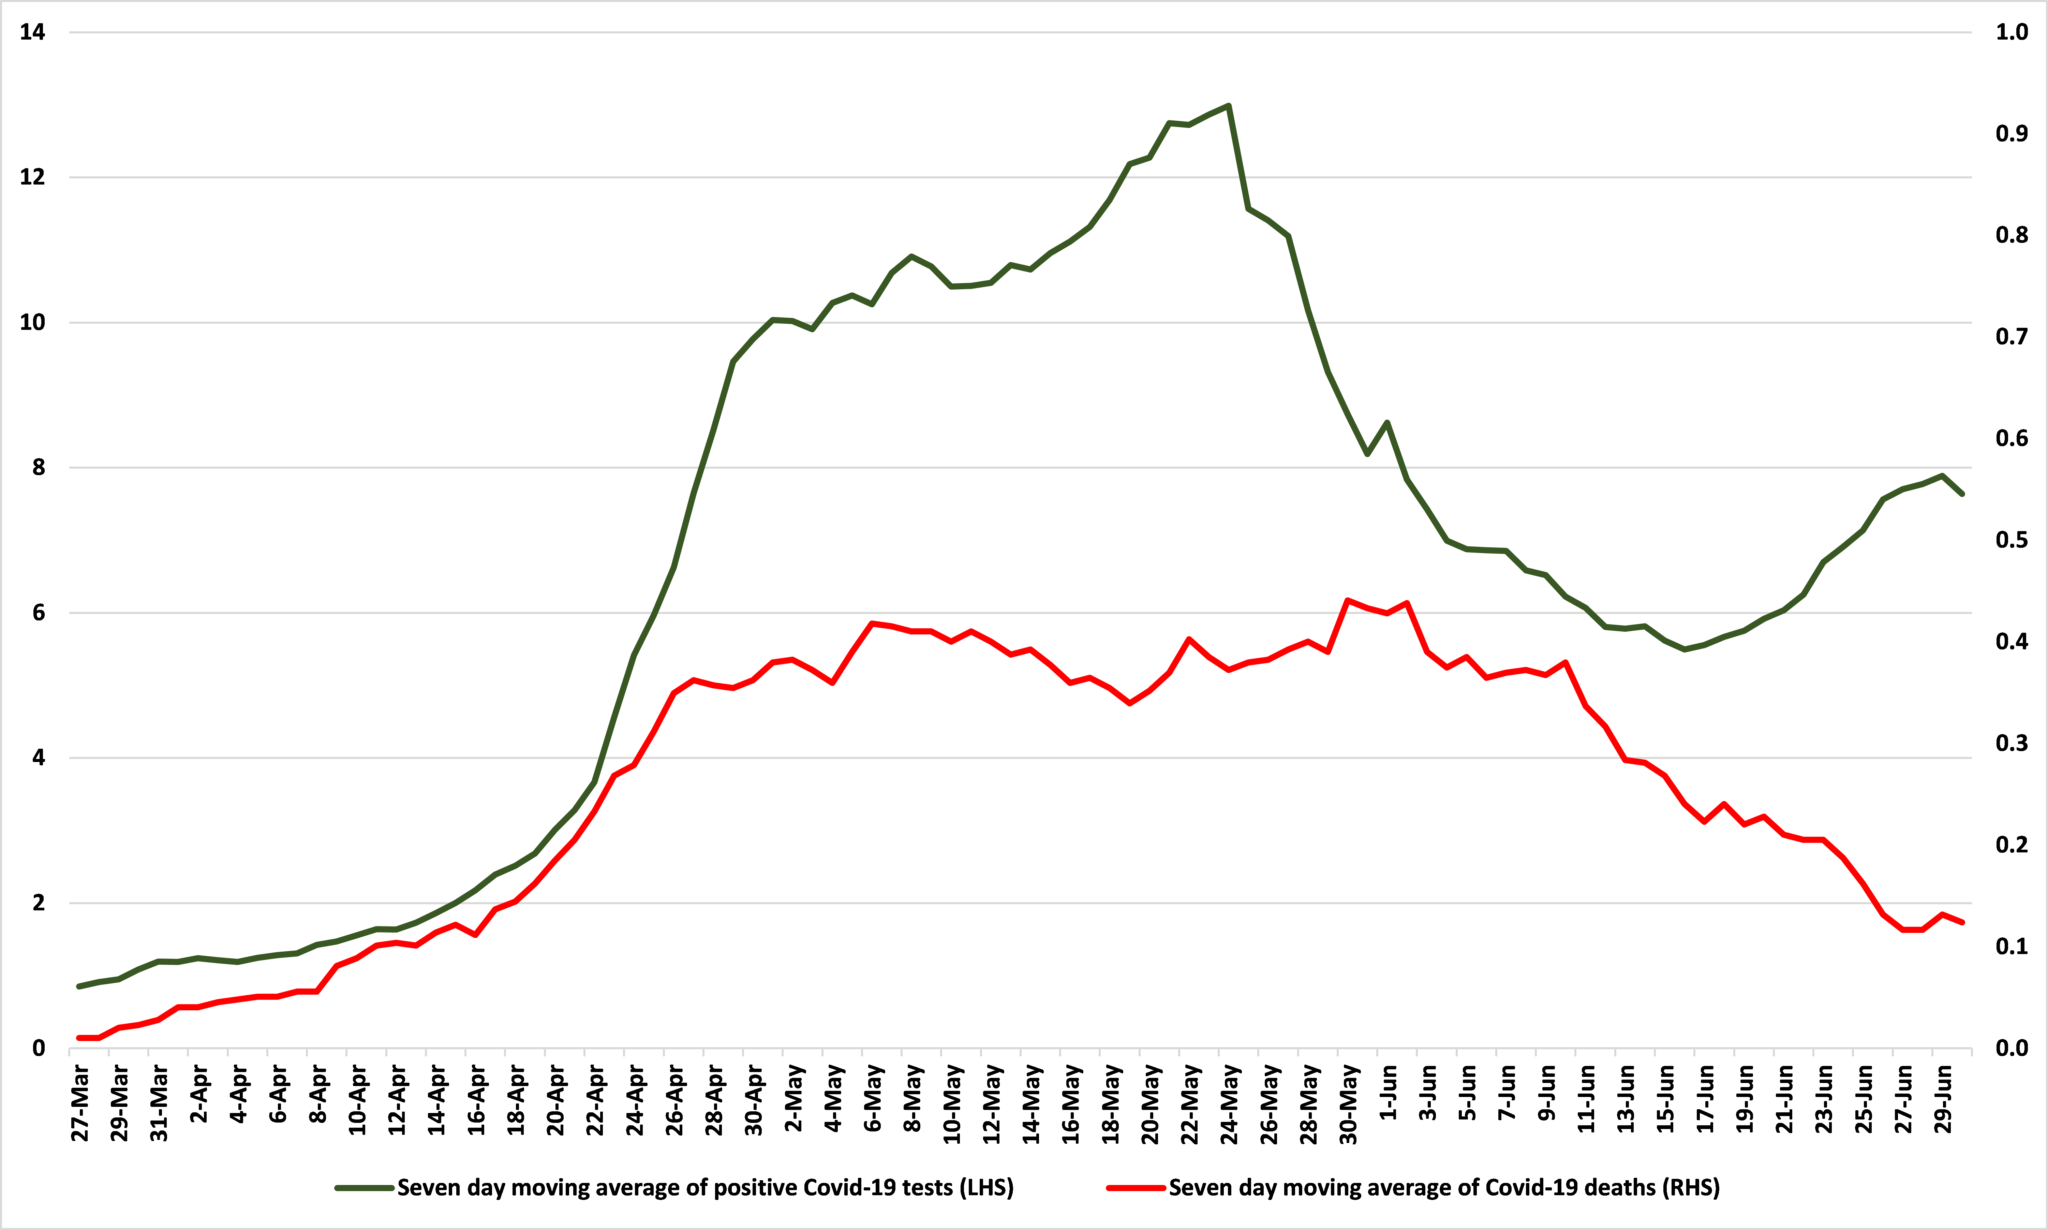
Source: Minnesota Department of Health
When Gov. Walz issued his stay-at-home order on March 25th, he did so in order to slow the spread of Covid-19 to buy time for the state to add the ICU capacity necessary to cope with the forecast surge. We now know that the peak was far lower than forecast and that hospitalizations and deaths continue to trend downward. While we need to remain vigilant in the fight against this disease, the data offers no reason to either impose new measures, like a statewide mask mandate, or continue some existing ones, such as his rule by decree.
*Numbers from subsequent days may be incomplete due to the need to confirm reports and reporting delays.
John Phelan is an economist at the Center of the American Experiment.