Data show that employment in Minnesota declined in October
Minnesota’s media is cock-a-hoop over the latest jobs numbers:
WCCO: Minnesota reached record 3 million jobs in October
Star Tribune: More than 3 million Minnesotans worked in October, the highest total ever recorded
KROC: Minnesota jobs total surpasses 3 million for the first time
Finance & Commerce: Total jobs surpass 3 million in Minnesota
KTTC: Record number of jobs reported in Minnesota
Pioneer Press: Minnesota adds 7,000 jobs in October; unemployment at 3.2%
KSTP: Minnesota surpasses 3 million jobs, highest on record, DEED reports
KNSI: Minnesota Celebrates Record Number of Jobs
Brainerd Dispatch: Minnesota posts third straight month of job growth; number of jobs reaches record high
Gov. Walz is celebrating, too:
Number of jobs
Indeed, new data from the Bureau of Labor Statistics on the total number of nonfarm jobs in the state do show that that number rose in our state in October for the third month in a row and crossed the 3 million threshold for the first time.
Is that really so impressive? After all, saying that the number of jobs has risen for three months in a row is the same as saying that it wasn’t rising until three months ago. The United States as a whole, by contrast, has seen the total number of nonfarm jobs rise in every single month since January 2021.
As Figure 1 shows, while it is true that the rate of job growth in Minnesota has outpaced that of the United States as a whole over the last three months, Minnesota’s relatively poor performance over a longer time span means that were are only playing catch up. Indeed, if we look at the growth in jobs since the trough of the COVID-19 recession in April 2020, we see that Minnesota has seen an increase of 16.5% while the United States as a whole has seen an increase of 20.3%.
Figure 1: Nonfarm job growth, Minnesota and the United States, January 2019 = 100
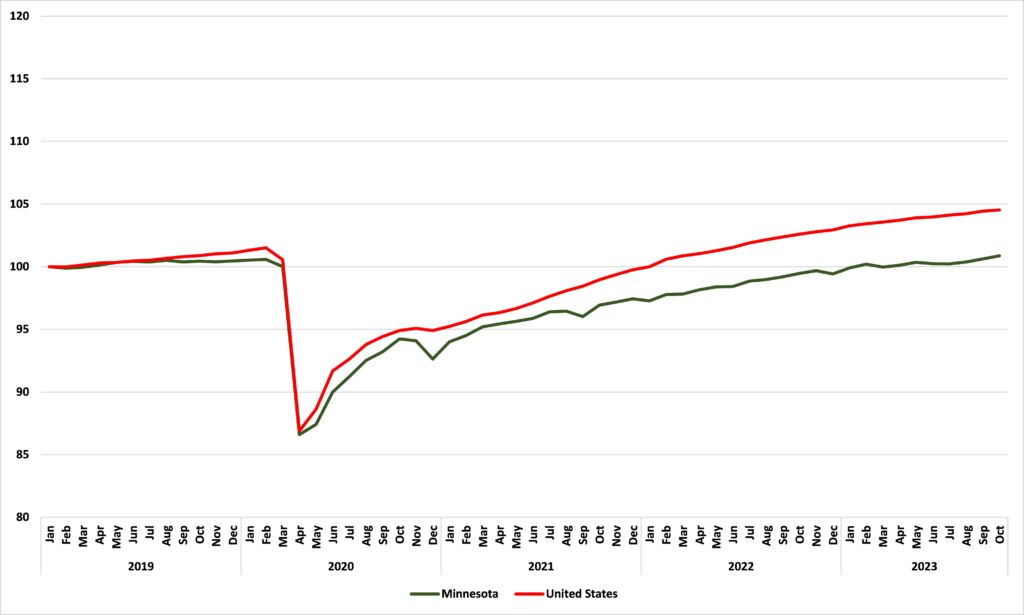
Source: Bureau of Labor Statistics
Number of people employed
I’ve made the point previously that, while the number of jobs is one thing — it comes from the BLS’ Establishment survey as part of its Current Employment Statistics (CES) survey — the number of people actually employed is another — this comes from the Household survey which is conducted by the U.S. Census Bureau as part of its Current Population Survey (CPS). What do we see when we look at those numbers?
As Figure 2 shows, the total number of people employed in Minnesota fell in October by 2,300. We should note that this was a smaller fall, in percentage terms, than that for the United States generally, but we should also note, again, that, over a longer time span, employment growth in Minnesota has lagged the national rate. Indeed, while the total number of people employed in the United States hit its peak in September, the peak in Minnesota was back in December 2019: total employment is still 11,300 below that.
Figure 2: Employment growth, Minnesota and the United States, January 2019 = 100
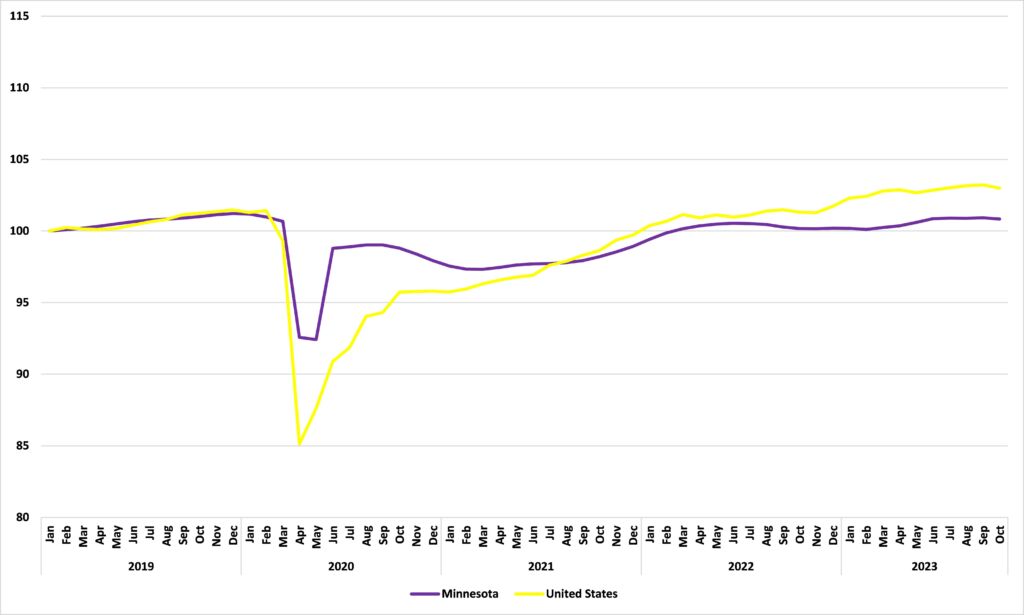
Source: Bureau of Labor Statistics
Putting it all together
Even with this relatively sluggish employment growth, Minnesota’s unemployment rate remains relatively low. That is because the growth rate of our total labor force has been similarly sluggish, in part because we hemorrhage residents to other states.
But how do we square increasing numbers of jobs with decreasing numbers of people employed, as we saw in October? Some of it, no doubt, is down to the fact that these are different surveys complied by different bodies measuring different things with different methods. But unless these surveys are useless, some of it, too, reflects more people holding multiple jobs. That is understandable in an economy where Americans are struggling to make ends meet, but it is not a cause for media celebration.