Minnesota’s Covid-19 ICU hospitalizations are down 58.8% from their December peak
Three weeks ago, I noted that Minnesota’s ICU hospitalizations were down 6.2% from their November peak. Happily, this trend has continued.
Data from the Minnesota Department of Health, seen in Figure 1, shows that, as of the seven days up to and including January 6th, total average ICU hospitalizations in the state are down 12.1% – or 138 beds – from their peak of the seven days up to and including November 21st. The rise in non-Covid-19 hospitalizations, starting in early December, has been more than offset by the decline in the number of Covid-19 patients, which started at the same time: these are down by 58.8% – or 228 beds – from their peak of the seven days up to and including December 1st/2nd. Capacity remains at 1,212, 34% down from November.
Figure 1: ICU hospitalizations in Minnesota, seven day moving average
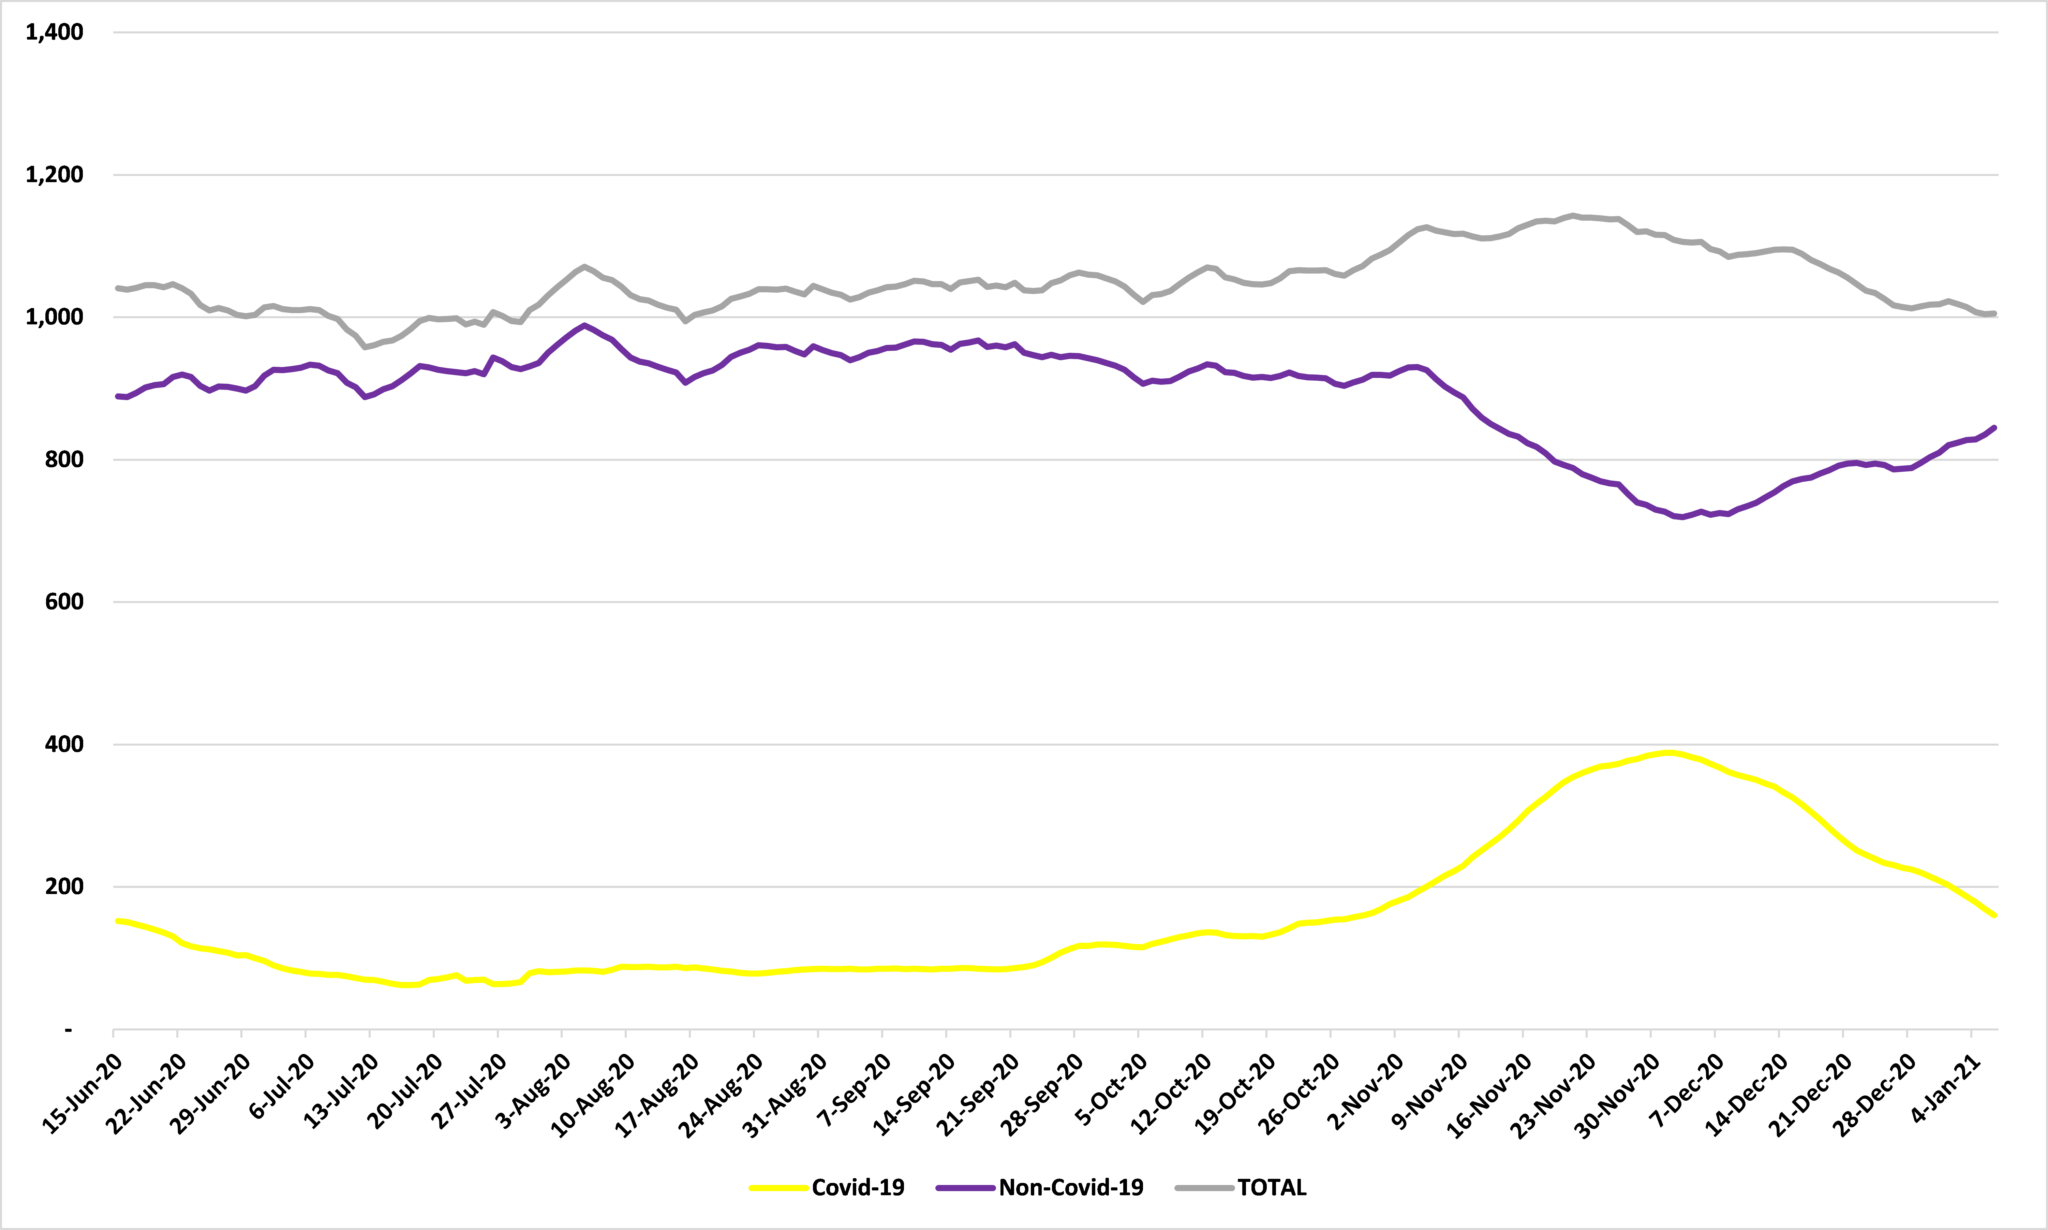
Source: Department of Health
The story is much the same with hospitalizations generally, as Figure 2 shows. In the seven days up to and including January 6th, total average non-ICU hospitalizations in Minnesota are down 16.6% – or 1,144 beds – from their peak in the seven days up to and including November 10th. Again, the rise in non-Covid-19 non-ICU hospitalizations has been more than offset by the decline in the number of Covid-19 non-ICU patients: these are down by 53.2% – or 757 beds – from their peak of the seven days up to and including November 25th.
Figure 2: Non-ICU hospitalizations in Minnesota, seven day moving average

Source: Department of Health
Are these the results of Gov. Walz’ latest shutdowns? That is unlikely.
It is commonly said that surges in cases – and falls too, presumably – precede surges/falls in hospitalizations which, in turn, precede surges/falls in deaths. But, as I wrote on Tuesday:
…the number of new cases peaked with an average of 6,871 in the seven days up to and including November 13th – one week before Gov. Walz’ shutdown of bars and restaurants went into effect on November 20th. The positivity rate likewise peaked and began falling before bars and restaurants were shutdown: at 18.6% in the seven days up to and including November 10th.
Figure 1: New Covid-19 cases and share of tests positive in Minnesota, seven day moving average
Source: Department of Health

If the decline in hospitalizations was the consequence of the decline in cases, it cannot be attributed to measures which were imposed after those measures were implemented.
John Phelan is an economist at the Center of the American Experiment.